. 2017 Apr 28:8:15008.
doi: 10.1038/ncomms15008.

HMGA1 amplifies Wnt signalling and expands the intestinal stem cell compartment and Paneth cell niche

Affiliations

HMGA1 amplifies Wnt signalling and expands the intestinal stem cell compartment and Paneth cell niche

Lingling Xian et al. Nat Commun. .

Abstract

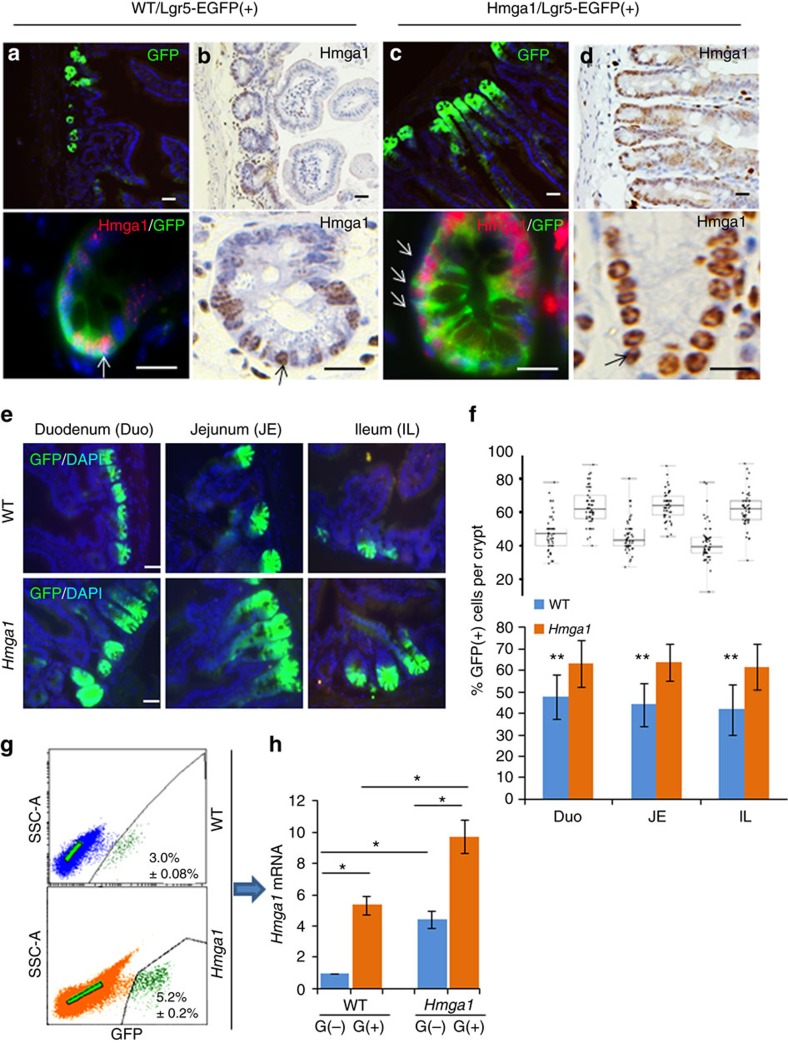
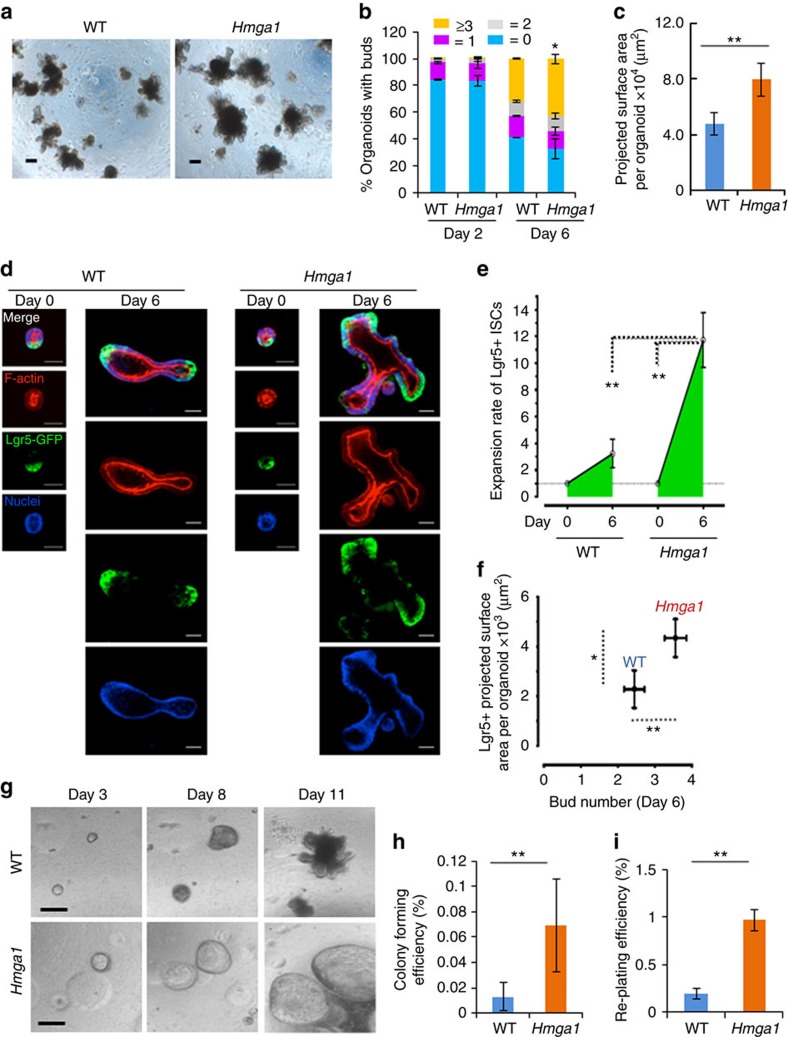
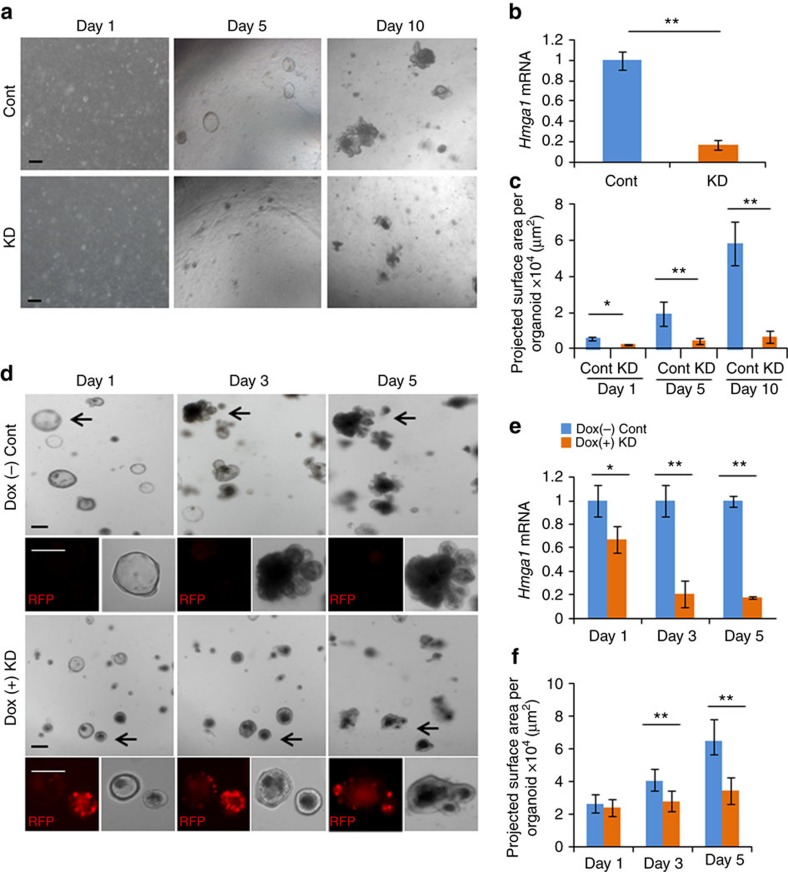
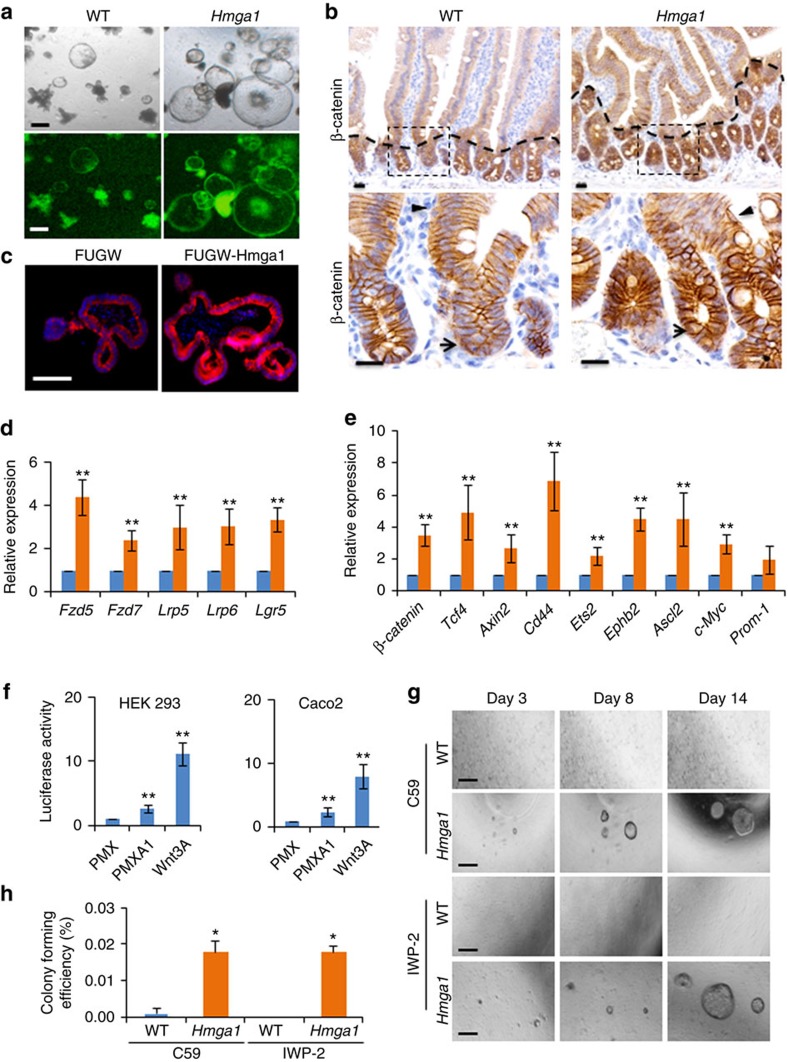
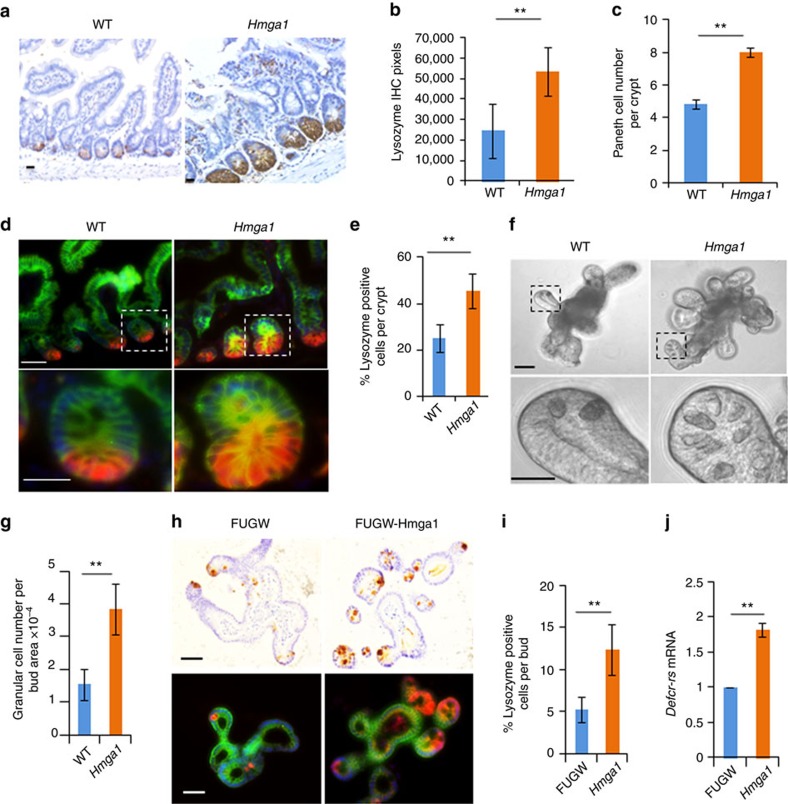
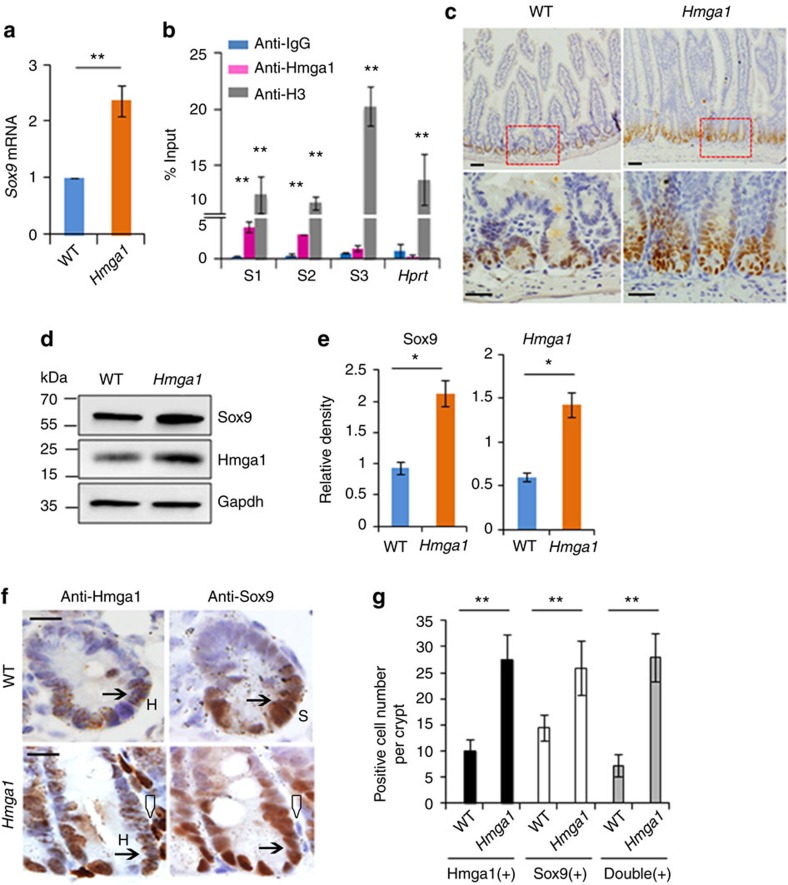
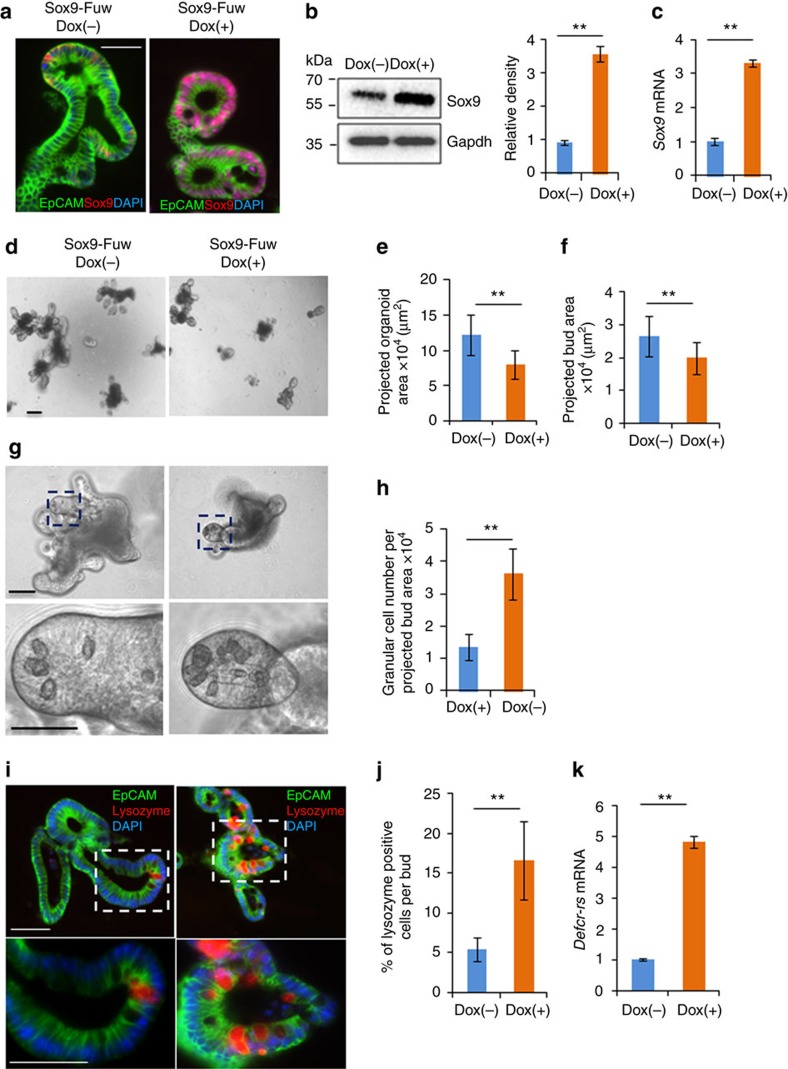
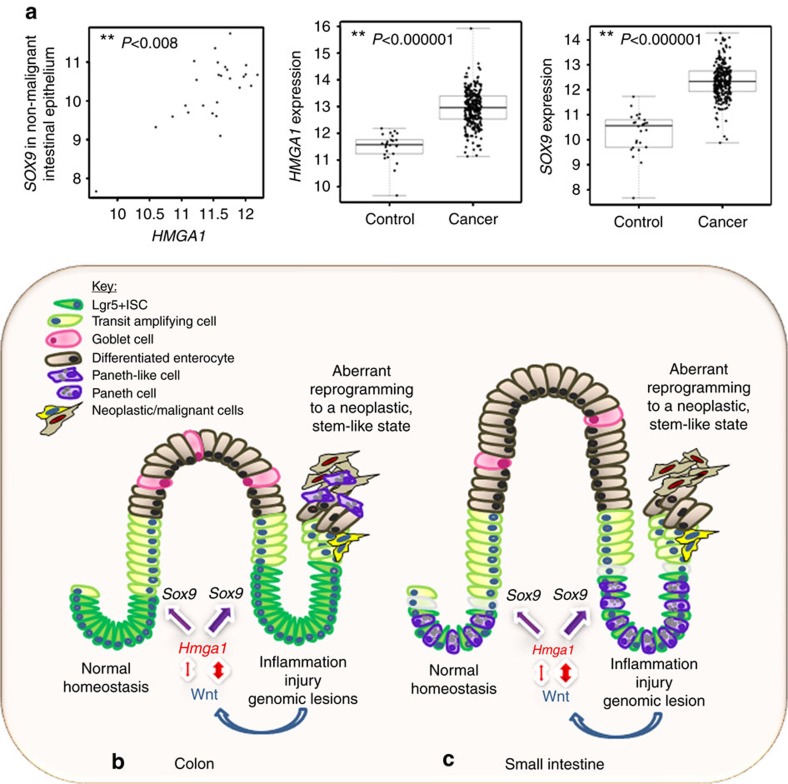
High-mobility group A1 (Hmga1) chromatin remodelling proteins are enriched in intestinal stem cells (ISCs), although their function in this setting was unknown. Prior studies showed that Hmga1 drives hyperproliferation, aberrant crypt formation and polyposis in transgenic mice. Here we demonstrate that Hmga1 amplifies Wnt/β-catenin signalling to enhance self-renewal and expand the ISC compartment. Hmga1 upregulates genes encoding both Wnt agonist receptors and downstream Wnt effectors. Hmga1 also helps to 'build' an ISC niche by expanding the Paneth cell compartment and directly inducing Sox9, which is required for Paneth cell differentiation. In human intestine, HMGA1 and SOX9 are positively correlated, and both become upregulated in colorectal cancer. Our results define a unique role for Hmga1 in intestinal homeostasis by maintaining the stem cell pool and fostering terminal differentiation to establish an epithelial stem cell niche. This work also suggests that deregulated Hmga1 perturbs this equilibrium during intestinal carcinogenesis.


Conflict of interest statement

The authors declare no competing financial interests.

Figures

Figure 1
Figure 1. Hmga1 localizes to ISCs and its overexpression expands the ISC compartment in transgenic mice.
(a) ISCs from WT/Lgr5-EGFP+ mice stain green (upper panel) in small intestinal cross-sections. Hmga1 stains red and localizes to GFP+ ISCs (lower panel). (b) Intranuclear Hmga1 stains brown (immunohistochemistry (IHC)) in small intestinal cross-sections from WT/Lgr5-EGFP+ mice. (c) ISCs stain green in Hmga1/Lgr5-EGFP+ transgenic mice and extend further up the base of the crypt in Hmga1 transgenic mice compared to WT mice. (Cells with red nuclear staining outside of crypts are Hmga1 transgenic lymphocytes) (d) Intranuclear Hmga1 stains brown (IHC) in small intestinal cross-sections from Hmga1/Lgr5-EGFP+ mice. (e) Fluorescent staining identifies GFP+ ISCs at each region in the small intestine of WT and Hmga1 mice (duodenum, jejunum, ileum). (f) The percentage (mean±s.d.) of GFP+ ISCs per crypt in WT and Hmga1 transgenic mice are shown; **P<0.00001, Mann–Whitney test (n=50 crypts per region, 3 mice per genotype). Dot plot shows individual data points. (g) Hmga1 transgenic mice have higher GFP+ ISC frequency as assessed by flow cytometry; mean frequency±s.d. from two experiments are shown. (h) Hmga1 mRNA is enriched in ISCs isolated by flow cytometry for GFP+ cells using quantitative, real-time PCR (qPCR) in WT and Hmga1 transgenic mice. Hmga1 is higher in both GFP+ ISCs and GFP− crypt cells from the Hmga1 transgenic model compared to WT mice. Bars show mean relative Hmga1 expression±s.d. from three experiments performed in triplicate; Gapdh was used as a loading control; *P<0.05; two-tailed Student's t-test. Scale bars, 20 μm.
Figure 2
Figure 2. Hmga1 enhances ISC function in gut organoid cultures.
(a) Typical 3D organoids cultured from crypts are shown from WT or Hmga1 transgenic mice. (b) Bud numbers were ascertained in 3D organoids from isolated crypts (n>100 organoids per mouse; 3 mice per genotype). Bars show mean percentage of organoids±s.d. with different bud numbers. (Yellow≥3, grey=2, pink=1, blue=0). The mean percentage of organoids with ≥ 3 buds was increased in Hmga1 organoids compared to WT organoids. *P<0.05; two-tailed Student's t-test. (c) Organoid projected surface area (PSA) is shown (mean±s.d.) from WT or Hmga1 mice (n>20 organoids/genotype). **P<0.01; two-tailed Student's t-test. (d) Representative confocal imaging of crypt cells (day 0) and organoids (day 6) with GFP+ staining for Lgr5+ ISCs, Phalloidin (F-actin; red) for cell clusters and organoid structure, and Hoechst (blue) for nuclei are shown. (e) Relative expansion rate of ISCs was calculated by the ratio of the PSA of GFP+ ISCs on day 6 (n≥42 organoids per group) over the PSA on day 0 (n≥72 crypt cell clusters/group). **P<0.01; Mann–Whitney test. (f) ISC PSA (y axis) and bud number (x axis) at days 0 and 6 are shown. **P<0.01, *P<0.05; Mann–Whitney test. (g) Lgr5-GFP+ ISCs were purified by flow cytometry and cultured in matrigel. (h) Colony (organoid)-forming efficiency (mean±s.d.) was calculated from purified GFP+ ISCs isolated as single cells (n=3,000 cells per group) from WT and Hmga1 mice in three experiments; **P<0.01; two-tailed Student's t-test. (i) Re-plating efficiency (mean±s.d.; n=3,000 cells per group) was assessed after dissociating colonies from purified GFP+ ISCs isolated as single cells from WT and Hmga1 mice using flow cytometry. **P<0.01; two-tailed Student's t-test. Scale bars, 50 μm.
Figure 3
Figure 3. Hmga1 deficiency disrupts ISC function in 3D organoids.
(a) Representative images of organoid formation after silencing Hmga1 by delivery of lentiviral vector expressing shRNA targeting Hmga1 (knockdown or KD) or control lentivirus (Cont) are shown. Scale bars, 50 μm. (b) Relative Hmga1 expression (mean±s.d.) was assessed from two experiments performed in triplicate (via qPCR) in organoids transduced with lentivirus (Cont versus KD) at day 10. Gapdh was used to control for loading. **P<0.01; two-tailed Student's t-test. (c) PSA (mean±s.d.) was assessed in organoids transduced with lentivirus (Cont versus KD) at the indicated time points (n=20 organoids per group). *P<0.05, **P<0.01; two-tailed Student's t-test. (d) Representative image of organoid formation±knockdown of Hmga1 via an inducible lentiviral vector expressing red fluorescent protein (RFP) and shRNA targeting Hmga1 are shown. Doxcyline (0.5 μg ml−1) was used to induce RFP and shRNA. Scale bars, 50 μm. (e) Relative Hmga1 expression (mean±s.d.) in organoids with or without induction of lentivirus shRNA targeting Hmga1 was assessed from two experiments performed in triplicate (via qPCR); Gapdh was used to control for loading. *P<0.05, **P<0.01; two-tailed Student's t-test. (f) PSA (mean±s.d.) of organoids with or without induction of Hmga1 knockdown at the indicated time points are shown (n=20 organoids per group from two different virus transduction experiments). **P<0.01; Mann–Whitney test.
Figure 4
Figure 4. Hmga1 amplifies Wnt signalling in ISCs.
(a) Representative organoids after exposure to Wnt3a (10 ng μl−1) are shown. Hmga1 organoids form large, cyst-like spheres (standard (top) and fluorescent (bottom) microscopy). Scale bars, 50 μm. (b) β-Catenin IHC staining is shown in small intestines from WT and Hmga1 mice. Scale bars, 20 μm. (c) β-Catenin IHC staining is shown in organoids engineered to express control lentivirus (FUGW; left) or Hmga1 (FUGW-Hmga1; right). Scale bar, 20 μm. (d) Relative expression (mean±s.d.) of genes encoding Wnt agonist receptors was ascertained by qPCR in GFP+ ISCs from WT (blue) or Hmga1 transgenic mice (orange) in two experiments performed in triplicate. Gapdh was used to control for loading. **P<0.01; two-tailed Student's t-test. (e) Relative expression (mean±s.d.) of genes encoding Wnt/Tcf4/β-catenin transcriptional targets was ascertained by qPCR in GFP+ ISCs from WT or Hmga1 transgenic mice in two experiments performed in triplicate. Gapdh was used to control for loading. **P<0.01; two-tailed Student's t-test. (f) HEK 293 (left) and Caco2 (right) cells infected with the synthetic Wnt reporter construct containing seven optimal Tcf4/β-catenin-binding sites showed activation in cells overexpressing Hmga1. Purified Wnt3A (100 ng ml−1) protein was used as a positive control. Bars show mean luciferase activity±s.d. from two experiments performed in triplicate. **P<0.01; two-tailed Student's t-test. (g) Representative image of GFP+ ISCs from WT or Hmga1 mice are shown in 3D culture with Wnt porcupine inhibitors IWP-2 (0.5 μM) and C59 (0.5 μM). Scale bars, 50 μm. (h) Relative colony-forming efficiency (mean±s.d.) from three experiments is shown with GFP+ ISCs from WT or Hmga1 mice in 3D culture with the Wnt porcupine inhibitors (IWP-2, C59). *P<0.05; two-tailed Student's t-test.
Figure 5
Figure 5. Hmga1 expands the Paneth cell niche.
(a) IHC for lysozyme is shown from small intestines of WT and Hmga1 transgenic mice. Scale bar, 20 μm. (b) Lysozyme IHC pixels (mean±s.d.; imagine pro-plus 6.0 software) is shown in small intestinal cross-sections (n=78 crypts per group; 3 mice per genotype). **P<0.01; Mann–Whitney test. (c) Paneth cell number (mean±s.d.) per crypt (n=100 crypts per group; 3 mice per genotype). **P<0.00001; Mann-Whitney test. (d) Immunofluorescent co-staining for lysozyme, Ep-CAM and DAPI is shown from small intestines of WT and Hmga1 transgenic mice. Scale bars, 20 μm. (e) Paneth cell frequency (mean±s.d.) was obtained by dividing the Paneth cell number by total cell number per crypt in WT and Hmga1 intestine (n=50 crypts per group; 3 mice per genotype). **P<0.00001; Mann–Whitney test. (f) Granular cells in WT and Hmga1 organoid buds are shown via phase contrast microscopy. Scale bars, 50 μm. (g) Granular cells per bud PSA (mean±s.d.) from WT and Hmga1 organoids are shown (n=35 buds per group). **P<0.00001; Mann–Whitney test. (h) IHC for lysozyme (top) and immunofluorescent co-staining for lysozyme, Ep-CAM and DAPI (bottom) are shown in organoids from WT or Hmga1 mice. Scale bars, 50 μm. (i) Paneth cell frequency per bud (mean±s.d.) was calculated by dividing the Paneth cell number by the total bud cell number (n=30 organoids per group). **P<0.00001; Mann–Whitney test. (j) Relative expression (mean±s.d.) of Defcr-rs, the Paneth cell-specific transcript, is shown from two experiments performed in triplicate from organoids from WT and Hmga1 mice. Gapdh was used to control for loading. **P<0.01; two-tailed Student's t-test.
Figure 6
Figure 6. Hmga1 directly induces Sox9 expression.
(a) Relative Sox9 mRNA (mean±s.d.) by qPCR in GFP+ ISCs from WT and Hmga1 mice is shown from two experiments performed in triplicate. Gapdh was used to control for loading. **P<0.01; Student's t-test. (b) Hmga1 binding to the Sox9 promoter by ChIP is shown from mouse crypt cells. IgG antibody and the Hprt promoter region were used as negative controls; histone H3 was a positive control. Bars show mean enrichment±s.d. from two experiments performed in triplicate; **P<0.01; two-tailed Student's t-test. (c) Sox9 IHC staining (brown) is shown in intestinal cross-sections from WT and Hmga1 transgenic mice. Scale bars, 20 μm. (d) Western blots for Sox9, Hmga1, and Gapdh (loading control) were performed from freshly isolated crypt cells from WT and Hmga1 transgenic mice. Western blots were done three times; a representative blot is shown. Size markers (kDa) are indicated. (e) Densitometry analysis±s.d. was performed on repeat western blots. *P<0.05; two-tailed Student's t-test. (f) Sox9 and Hmga1 IHC staining (brown) is shown in adjacent sections of small intestine from WT and Hmga1 mice. Arrows show representative staining for Hmga1 (H) or Sox9 (S); triangles show Hmga1 transgenic lymphocytes which have high levels of Hmga1 (but not Sox9). Scale bars, 50 μm. (g) Mean number of cells±s.d. staining positive for Hmga1, Sox9 or both were identified by IHC in adjacent cross-section on slides of small intestinal crypts from WT and Hmga1 mice (n≥21 crypts per group.) **P<0.01 by Mann–Whitney test.
Figure 7
Figure 7. Paneth cell number increases in organoids overexpressing Sox9.
(a) Immunofluorescent stain for Sox9 (red), DAPI (blue) and EpCAM (green) is shown in organoids transduced with lentivirus expressing doxycycline-dependent inducible Sox9 (Sox9-Fuw). Sox9 (Sox9-Fuw Dox(+)) was induced by doxycycline (1 μg ml−1) for 5 days; controls were cultured for 5 days without doxycycline. (b) Representative western blot for Sox9 in control and induced organoids is shown. Densitometry±s.d. was performed on three repeat western blots. **P<0.01; two-tailed t-test. (c) Sox9 mRNA (mean±s.d.) was assessed by qPCR from two experiments performed in triplicate in control and induced organoids. Gapdh was used to control for loading. **P<0.01; two-tailed Student's t-test. (d) Typical organoids from uninduced controls (left) and induced (right) cultures are shown. (e) PSA±s.d. of organoids (n=52 per group) are shown. **P<0.01; two-tailed Student's t-test. (f) PSA±s.d. of buds (n=52 per group) are shown. **P<0.01; two-tailed Student's t-test. (g) Paneth cells identified as granular cells using phase contrast microscopy within individual buds are shown. (h) Granular cell frequency (mean±s.d.) was estimated by dividing the total granular cell number by the total bud PSA (n=52 per group). **P<0.01; Mann–Whitney test. (i) Paneth cells were identified based on lysozyme stain (red) in cells delineated by EpCAM (green) for cell membrane and (DAPI) for nuclei. (j) Paneth cell frequency (mean±s.d.) was ascertained by dividing the number of lysozyme staining cells (red) delineated by EpCAM (green) by the total cell number (DAPI) per bud (n=35 per group). **P<0.01; Mann–Whitney test. (k) Relative expression of Defc-rs (mean±s.d.) was compared in uninduced control and Sox9-induced organoids by qPCR from two experiments performed in triplicate. Gapdh was used to control for loading. **P<0.01; two-tailed Student's t-test. Scale bars, 50 μm.
Figure 8
Figure 8. Hmga1 in normal intestinal homeostasis and reprogramming to neoplasia.
(a) There is a significant positive correlation (r=0.51; P=0.008) between HMGA1 and SOX9 in control, non-malignant large intestinal epithelium by Spearman's correlation (n=26). There is also a highly significant upregulation of both HMGA1 and SOX9 in colorectal cancer (n=293, P<0.000001). Boxplots, scatterplots and Spearman rank-based correlations were calculated using R statistical software. (b) Model depicting normal ISC function and tissue homeostasis in the large intestine under conditions of tightly regulated Hmga1 expression and Wnt signalling (left). Intestinal epithelium homeostasis is disrupted (right) in the setting of aberrant Hmga1 expression, leading to expansion in the ISC compartment, excessive Wnt signalling, and abnormal proliferation, culminating in epithelial reprogramming to neoplastic, transformed cells. (c) Model depicting normal ISC function and tissue homeostasis in the small intestine under conditions of tightly regulated Hmga1 expression, Paneth cell differentiation and Wnt signalling (left). Expansion in the ISCs and Paneth cell niche occurs when homeostasis is disrupted (right) in the setting of aberrant Hmga1 expression. This contributes to amplified Wnt signalling, abnormal proliferation, epithelial reprogramming and neoplastic transformation.

References

    1. Clevers H. The intestinal crypt, a prototype stem cell compartment. Cell 154, 274–284 (2013). - PubMed
    1. Koo B. K. et al.. Controlled gene expression in primary Lgr5 organoid cultures. Nat. Methods 9, 81–83 (2011). - PubMed
    1. Koo B. K., Sasselli V. & Clevers H. Retroviral gene expression control in primary organoid cultures. Curr. Protoc. Stem Cell Biol. 27, 5A.6.1-5A.6.8 (2013). - PubMed
    1. Sato T. & Clevers H. Growing self-organizing mini-guts from a single intestinal stem cell: mechanism and applications. Science 340, 1190–1194 (2013). - PubMed
    1. Koo B. K. & Clevers H. Stem cells marked by the R-spondin receptor LGR5. Gastroenterology 147, 289–302 (2014). - PubMed

Publication types

MeSH terms