. 2017 Apr 28:8:15153.
doi: 10.1038/ncomms15153.

Activin A more prominently regulates muscle mass in primates than does GDF8

Affiliations

Activin A more prominently regulates muscle mass in primates than does GDF8

Esther Latres et al. Nat Commun. .

Abstract

Growth and differentiation factor 8 (GDF8) is a TGF-β superfamily member, and negative regulator of skeletal muscle mass. GDF8 inhibition results in prominent muscle growth in mice, but less impressive hypertrophy in primates, including man. Broad TGF-β inhibition suggests another family member negatively regulates muscle mass, and its blockade enhances muscle growth seen with GDF8-specific inhibition. Here we show that activin A is the long-sought second negative muscle regulator. Activin A specific inhibition, on top of GDF8 inhibition, leads to pronounced muscle hypertrophy and force production in mice and monkeys. Inhibition of these two ligands mimics the hypertrophy seen with broad TGF-β blockers, while avoiding the adverse effects due to inhibition of multiple family members. Altogether, we identify activin A as a second negative regulator of muscle mass, and suggest that inhibition of both ligands provides a preferred therapeutic approach, which maximizes the benefit:risk ratio for muscle diseases in man.


Conflict of interest statement

All authors except E.L. and T.W. are current employees of Regeneron Pharmaceuticals. E.L. and T.W. were employees of Regeneron Pharmaceuticals when this study was conducted. J.M., W.F., L.M., J.T., J.P., H.O., K.C., E.N., A.P., Y.B., J.H.K., A.R., S.J., T.S., A.J.M., G.D.Y. and J.G. are currently employees and hold stock or stock options of Regeneron Pharmaceuticals. Regeneron Pharmaceuticals and E.L., T.S., A.J.M., G.D.Y. and J.G. hold patents for antibodies inhibiting GDF8 and activin A and uses thereof.

Figures
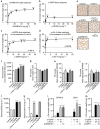
Figure 1
Figure 1. Activin A and GDF8 inhibition synergistically increase muscle mass in mice.
Changes in TA muscle weight following administration of increasing doses of (a) ActRIIB.hFc (n=7), (b) α-GDF8 (n=10, except for 0.1 and 0.75 mg kg−1 doses, n=5), (c) α-GDF8 in the presence of 10 mg kg−1 α-Act A (n=7, except for 2.5, 25 and 50 mg kg−1 doses, n=8) and (d) α-Act A in the presence of 10 mg kg−1 of α-GDF8 (n=5, except for 0.3 and 1.0 mg kg−1 doses, n=6) in male SCID mice for 21 days. Change in TA muscle weight was calculated as the difference versus isotype control group mean. (e) Representative images of laminin staining of TA muscle from mice injected with 10 mg kg−1 of α-Act A, α-GDF8, the combination of α-Act A and α-GDF8 or ActRIIB.hFc for 21 days (n=6, except for ActRIIB.hFc, n=9). Mean fibre cross-sectional area (f) and fibre number per section (g) from studies described in e. mRNA levels of Mstn (h) and Inhba (i) from TA muscle of SCID mice treated with α-Act A or α-GDF8, the combination of the antibodies or ActRIIB.hFc for 21 days (10 mg kg−1 each, n=7). Data expressed in reads per kilobase of transcript per million mapped reads (RPKM). ELISA data for GDF8 (j) and activin A (k) from SCID mice treated for 21 days with α-GDF8, α-Act A or the combination (control group in j, n=5, all others n=6). (l) Change in TA muscle weights in C57BL/6 mice compared to SCID mice after 21 days of treatment (n=5 for C57BL/6 study; n=12 for the control, n=5 for the α-GDF8 and combination groups, n=10 for the ActRIIB.hFc in SCID study). (m) Change in TA muscle weights in SCID mice following treatment with α-Act A and α-GDF8 combination (10 mg kg−1 each, n=7) in the absence or presence of α-GDF11 antibody (10 mg kg−1, n=6). Data are mean±s.e.m. *P<0.05, **P<0.01, ***P<0.001, ****P<0.0001 versus control (a, b, f, jm), 10 mg kg−1 α-Act A (c) or 10 mg kg−1 α-GDF8 (d) by one-way ANOVA and Bonferroni post hoc test.
Figure 2
Figure 2. Activin A and GDF8 inhibition increases muscle force in mice.
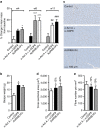
(a) Twitch force of TA muscle from mice injected with 10 mg kg−1 α-Act A (n=15), α-GDF8 (n=10), the combination of α-Act A and α-GDF8 (n=9), ActRIIB.hFc (n=10) or isotype control antibody (n=22) for 21 days. (b) Correlation of twitch force to fibre cross-sectional area for a subset of the mice described in a. (c) Isometric tetanic force in ex vivo TA muscle over stimulation frequencies of 40–150 Hz for the mice described in a. (d) Peak tetanic force from the groups in c. (e) Specific force for the groups in c. Data are shown as mean±s.e.m. *P<0.05, **P<0.01, ****P<0.0001 versus control. For c, a=α-Act A+α-GDF8 and ActRIIB.hFc groups significant to control, b=α-Act A, α-ActA+α-GDF8 and ActRIIB.hFc groups significant to control, c=α-Act A, α-GDF8, α-Act A+α-GDF8 and ActRIIB.hFc groups significant to control, d=α-GDF8, α-Act A+α-GDF8 and ActRIIB.hFc groups significant to control. Statistical significance was calculated using one-way (a,d) or two-way (c) ANOVA with Bonferroni post hoc test.
Figure 3
Figure 3. Downregulation of TGF-β pathway genes in TA muscle by RNAseq.
(a) Heat map of the union of 1,670 genes perturbed by α-GDF8, α-Act A, the combination of α-Act A and α-GDF8 or ActRIIB.hFc following dosing at 10 mg kg−1 for 10 days (n=7). (b) IPA analysis of TGF-β pathway as measured by P value and z-score from each treatment group. (ce) IPA analysis showing P value and z-score of other top-regulated common pathways in the α-Act A and α-GDF8 combination and ActRIIB.hFc treatment groups. N.R., not regulated.
Figure 4
Figure 4. Activin A and GDF8 inhibition improve recovery from atrophy in mice.
(a,b) Change in TA and GA muscle weights of C57BL/6 mice following 7 days of HLS and 7 days of recovery. Immediately or 3 days after 7-day recovery, mice were treated with either an isotype control antibody (25 mg kg−1), α-GDF8 alone or in combination with α-Act A (each 25 mg kg−1) or ActRIIB.hFc (25 mg kg−1). Untreated and HLS control mice were euthanized at day 7, all other groups were euthanized at day 14 of the study, n=10 per group. (c,d) Change in TA and GA muscle weights in mice infused with dexamethasone (Dex; 23 μg per day) for 14 days and treated with α-GDF8 alone or in combination with α-Act A (each 25 mg kg−1) or ActRIIB.hFc (25 mg kg−1). Mice were all given four doses on D0, D3, D7 and D10. Control group was infused with saline. Data are mean±s.e.m. (a,b) *P<0.05, **P<0.01, ***P<0.001 versus no HLS. ^P<0.05, ^^P<0.01, ^^^P<0.001, ^^^^P<0.0001 versus HLS control. (c,d) *P<0.05, **P<0.01 versus saline control. ^P<0.05, ^^^P<0.001, ^^^^P<0.0001 versus Dex control. Statistical significance was calculated by one-way ANOVA with Bonferroni post hoc test.
Figure 5
Figure 5. Activin A and GDF8 inhibition synergistically increase lean mass in monkeys.
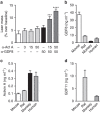
(a) Per cent change in lean mass over baseline in male and female cynomolgus monkeys (n=5 per gender per group). Doses shown in mg kg−1. Basal serum levels of (b) GDF8, (c) activin A and (d) GDF11 in SCID mice (n=8), rats (n=8), cynomolgus monkeys (n=6) and humans (n=5 per gender; 18–43 years of age). Data are shown as mean±s.e.m. ***P<0.001, ****P<0.0001 versus saline control by one-way ANOVA and Bonferroni post hoc test.
Figure 6
Figure 6. Combination treatment increases lean mass similar to ActRIIB.hFc in monkeys.
(a) Per cent change over baseline of lean mass in cynomolgus monkeys (n=3 per gender per group) at weeks 4, 8 and 11 of dosing compared to pretreatment. Dosing was 50 mg kg−1 of each antibody i.v. for 11 weeks. (b) Terminal biceps weight for each group with representative sections given in c. Quantitation of bicep fibre size (d) and fibre number (e) with mean values shown above bars. Data are shown as mean±s.e.m. *P<0.05 versus 4 week saline control, ^^^P<0.001 versus 8 week saline control, ##P<0.01, ###P<0.001 versus 11 week saline control (a) and *P<0.05 versus saline control (b) by one-way ANOVA with Bonferroni post hoc test.
Figure 7
Figure 7. ActRIIB.hFc effects on glucose homeostasis and spleen hematopoiesis in mice.
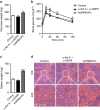
(a) Pancreas weight following 8 days of treatment (n=6). (b) Blood glucose curves following oral glucose tolerance performed after 7 days of treatment (n=6). (c) Spleen weights following 22 days of treatment (n=7). (d) Representative histological images of the spleen for each group following 22 days of treatment. Data are shown as mean±s.e.m. *P<0.05, **P<0.01, ****P<0.0001 versus control by one-way or two-way ANOVA with Bonferonni post hoc test.

References

    1. McPherron A. C., Lawler A. M. & Lee S. J. Regulation of skeletal muscle mass in mice by a new TGF-β superfamily member. Nature 387, 83–90 (1997). - PubMed
    1. Lee S. J. & McPherron A. C. Regulation of myostatin activity and muscle growth. Proc. Natl Acad. Sci. USA 98, 9306–9311 (2001). - PMC - PubMed
    1. Han H. Q. et al.. Myostatin/activin pathway antagonism: molecular basis and therapeutic potential. Int. J. Biochem. Cell Biol. 45, 2333–2347 (2013). - PubMed
    1. Sartori R., Gregorevic P. & Sandri M. TGFβ and BMP signaling in skeletal muscle: potential significance for muscle-related disease. Trends Endocrinol. Metab. 25, 464–471 (2014). - PubMed
    1. Cohen S. et al.. Muscle wasting in disease: molecular mechanisms and promising therapies. Nat. Rev. Drug Discov. 14, 58–74 (2015). - PubMed

MeSH terms