

doi: 10.1038/335700a0.
Structural characterization of folding intermediates in cytochrome c by H-exchange labelling and proton NMR
Affiliations
- PMID: 2845279
- PMCID: PMC3430852
- DOI: 10.1038/335700a0
Item in Clipboard
Structural characterization of folding intermediates in cytochrome c by H-exchange labelling and proton NMR
Nature.
.
Abstract
To understand the process of protein folding, it will be necessary to obtain detailed structural information on folding intermediates. This difficult problem is being studied by using hydrogen exchange and rapid mixing to label transient structural intermediates, with subsequent analysis of the proton-labelling pattern by two-dimensional nuclear magnetic resonance spectroscopy. Results for cytochrome c show that the method provides the spatial and temporal resolution necessary to monitor structure formation at many defined sites along the polypeptide chain on a timescale ranging from milliseconds to minutes.
Figures
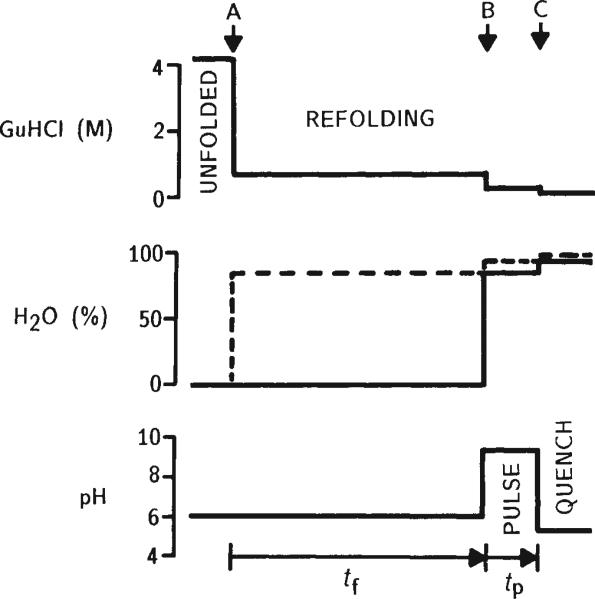
Schematic illustration of the H-exchange pulse labelling method used in kinetic refolding experiments with cytochrome c. The relevant solution conditions are shown in relation to three rapid mixing events (arrows). All experiments were performed at 10°C on a commercial preparative rapid-mixing apparatus (Hi-Tech, Salisbury, UK) with an estimated mixing dead time of about 2 ms. Oxidized cytochrome c (type VI from horse heart, purchased from Sigma) was initially dissolved in D2O at pD 6.0 containing 4.2 M guanidine hydrochloride (GuHCl) as a denaturant. These conditions were shown to produce complete unfolding of cytochrome c, as judged by circular dichroism and hydrogen exchange, with the exception of a limited amount of residual structure in the vicinity of the His 18 haem ligand (unpublished data). Initial protein concentration was 6 mM. Refolding was initiated in the first mixer (A) by rapid 6-fold dilution with 0.1 M acetate at pH 6.2 in H2O (dashed line). The resulting GuHCl concentration (0.7 M) is well below the unfolding transition. After variable refolding times (tf), the solution was combined in a second mixer (B) with an equal volume of an H2O buffer (0.1 M sodium phosphate, 0.1 M glycine) at pH 9.3 (final pH determined in a separate control). Under these pulse conditions, freely accessible amide protons exchange in about 1 ms (ref. 22). The labelling pulse was terminated after 50± 10 ms by a rapid pH change to 5.3, accomplished by injecting the solution at the exit of the mixing apparatus into a reservoir of quench buffer (0.3 M sodium citrate, 0.05 M sodium ascorbate, 0 °C) under vigorous stirring (C). The quench conditions favour slow H-exchange (intrinsic exchange times are ~10 s) and rapid refolding. The ascorbate in the quench solution serves both as pH buffer and reducing agent for cytochrome c, taking advantage of the fact that many amide protons exchange much more slowly in the reduced form of the protein. This procedure, with H2O present in the refolding period, was used for experiments at refolding times tf < 1 s. At longer times, H-exchange is no longer negligible (typical free-peptide exchange times are about 3 s at pH 6,10 °C), and refolding has to be done in D2O (solid line in centre panel). Subsequent preparation of samples for NMR analysis was carried out at 4 °C. Unfolding was not completely reversible under the conditions used; varying amounts of aggregated or incorrectly refolded protein were detected by NMR. The native monomeric fraction was isolated by use of Biorex-70 cation exchange columns. Washing with 0.7 M NaCl, 0.1 M NaPO4 (pH 6.0) elutes the native cytochrome c and not the incorrectly folded (aggregated) material. The protein was concentrated and transferred into D2O by repeated dilution and ultrafiltration. The final NMR sample conditions were between 3 and 5 mM reduced cytochrome c in D2O, pD 5.3, 0.05 M K3PO4, 0.01 M ascorbate. Samples were stored at 4 °C before NMR measurements performed within 24 hours, or at –85 °C for prolonged periods.
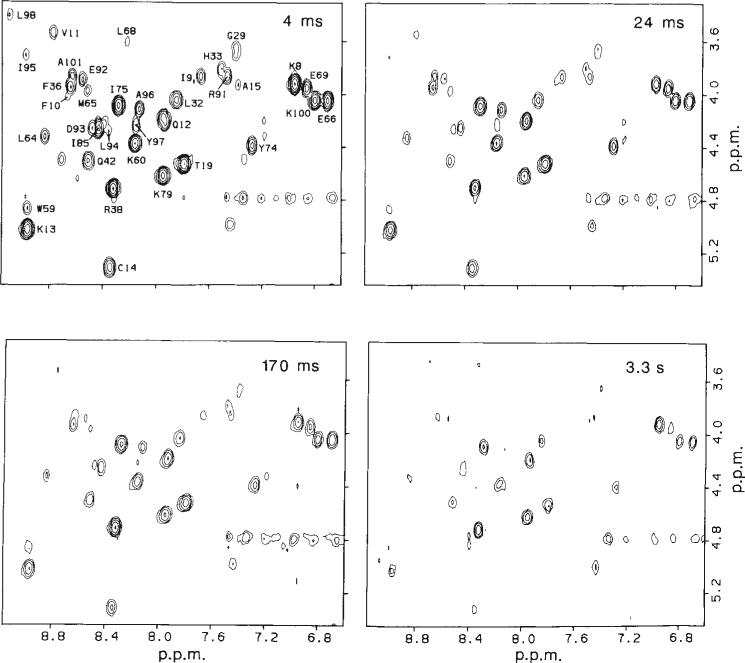
Two-dimensional NMR analysis of representative cytochrome c samples prepared by the pulse labelling method outlined in Fig. 1. Sections of 2-D J-correlated (COSY) contour plots containing the majority of the NH–CαH cross peaks are shown for samples labelled at four different refolding times. The residue assignments obtained by Wand el al. are indicated. Magnitude COSY spectra, were recorded at 20°C on a 500 MHz Bruker AM 500 spectrometer. One hundred and twenty eight transients of 1,024 complex data points covering a spectral width of 9,090 Hz were recorded for each of 400 t1 increments (0 to 44 ms). The data were processed on a Micro VAX computer, using the FTNMR program provided by Dennis Hare. Unshifted sine multiplication and a 2 Hz line-broadening were applied in both dimensions before Fourier transformation. The final digital resolution was 8.9 Hz per point in both dimensions. Cross-peak intensities were measured by volume integration, using a 3-point radius. The average volume of three cross peaks between non-labile protons (not shown) was used as an internal intensity standard. Relative proton occupancies at individual amide NH sites were obtained by using the unfolded control (see text) for normalization; the COSY cross-peak intensities of the control were taken to correspond to 100% proton occupancy.
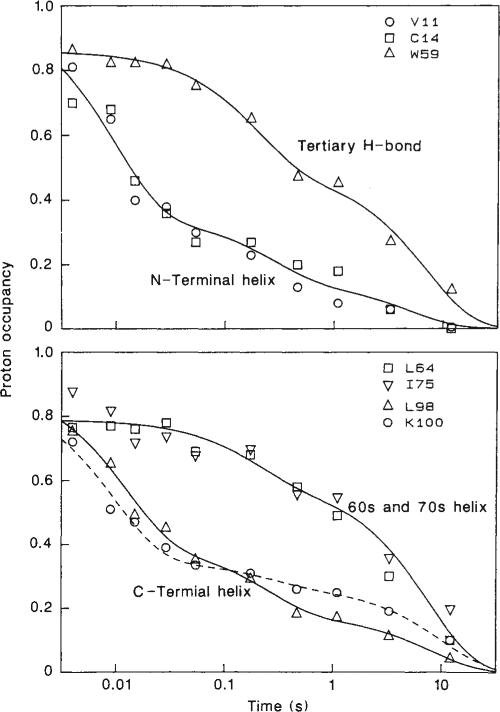
Time course of protection against H-exchange labelling for a representative set of backbone NH sites, distributed along the cytochrome c polypeptide chain, and one side chain NH (Trp 59). Proton occupancies are plotted as a function of the refolding time, tf, on a logarithmic scale. The curves represent sums of two (top curve in each panel) or three (bottom curve in each panel) exponential terms. Sample preparation and NMR analysis are described in Figs 1 and 2 respectively. As the Leu 98 backbone NH and the Trp 59 indole NH produce weak COSY cross peaks but are well resolved in the 1-D NMR spectrum, these protons were measured by integration of their resonances in 1-D NMR spectra recorded before and after 2-D experiments.
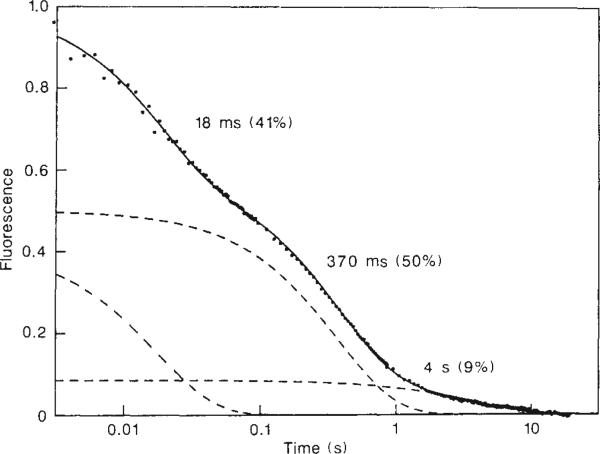
Refolding kinetics in cytochrome c at 10°C, monitored by the fluorescence of a single tryptophan residue (Trp 59). The data were collected on a Hi-Tech stopped-flow apparatus, using a deuterium lamp for excitation at 280 nm and observation of the fluorescence emission at 350 nm. As in the pulse labelling experiments (Fig. 1), cytochrome c was unfolded in 4.2 M GuHCl, pH 6.0, and refolded at pH 6.2 in the presence of 0.7 M GuHCl. The final protein concentration was 5 × 10⁻⁶ M. Under these conditions, unfolding was fully reversible. The kinetic data are presented on the same logarithmic timescale used in Fig. 3. The solid curve was obtained by nonlinear least-squares fitting of three exponential phases, resulting in the indicated time constants and amplitudes. The individual phases are displayed separately with dashed lines.
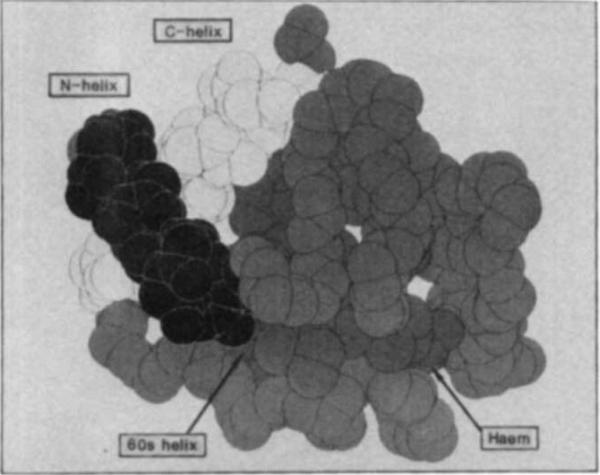
Space-filling model of cytochrome c (ref. 13) showing the location of various structural elements followed in the refolding experiments. Side chains are omitted. The view was chosen to emphasize the contact between the N-terminal (dark) and C-terminal (light) α-helices which is formed early in folding. Also identified are the 60s helix, an example of a structural feature formed late in folding, and the haem. Trp 59 is behind the lower right edge of the haem.
References
-
- Kim PS, Baldwin RLA. Rev. Bioehem. 51:459–489. 9821.
-
- Creighton TE. Prog. Biophys. molec. Biol. 1978;33:231–297. - PubMed
-
- Schmid FX, Baldwin RL. J. molec. Biol. 1979;135:199–215. - PubMed
-
- Kim PS, Baldwin RL. Biochemistry. 1980;19:6124–6129. - PubMed
-
- Udgaonkar JB, Baldwin RL. Nature. 1988;335:694–699. - PubMed
Publication types
MeSH terms
Substances
Grants and funding
LinkOut - more resources
Full Text Sources
Other Literature Sources
