Multicenter Study
. 2017 Jun;23(6):946-955.
doi: 10.1097/MIB.0000000000001131.

Azathioprine with Allopurinol: Lower Deoxythioguanosine in DNA and Transcriptome Changes Indicate Mechanistic Differences to Azathioprine Alone

Affiliations
Multicenter Study

Azathioprine with Allopurinol: Lower Deoxythioguanosine in DNA and Transcriptome Changes Indicate Mechanistic Differences to Azathioprine Alone

Sally A Coulthard et al. Inflamm Bowel Dis. 2017 Jun.

Abstract

Background: Use of azathioprine (AZA) for inflammatory bowel disease is limited by side effects or poor efficacy. Combining low-dose azathioprine with allopurinol (LDAA) bypasses side effects, improves efficacy, and may be appropriate as first-line therapy. We test the hypothesis that standard-dose azathioprine (AZA) and LDAA treatments work by similar mechanisms, using incorporation of the metabolite deoxythioguanosine into patient DNA, white-blood cell counts, and transcriptome analysis as biological markers of drug effect.

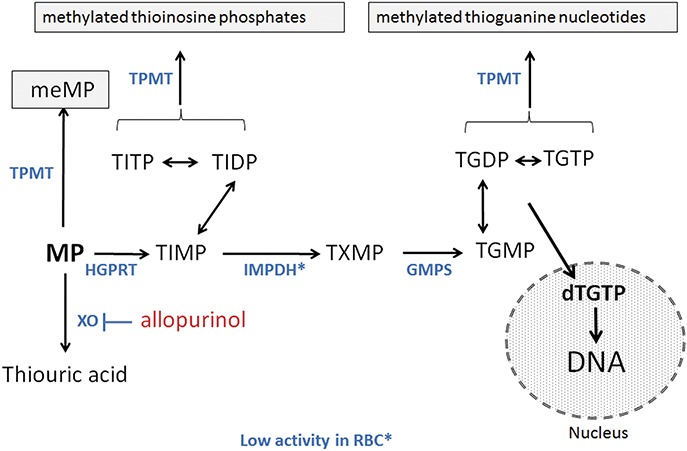
Methods: DNA was extracted from peripheral whole-blood from patients with IBD treated with AZA or LDAA, and analyzed for DNA-incorporated deoxythioguanosine. Measurement of red-blood cell thiopurine metabolites was part of usual clinical practice, and pre- and on-treatment (12 wk) blood samples were used for transcriptome analysis.

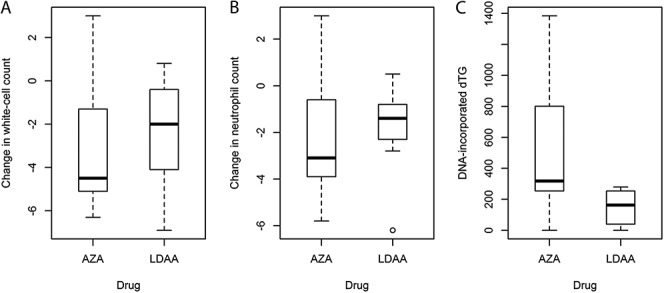
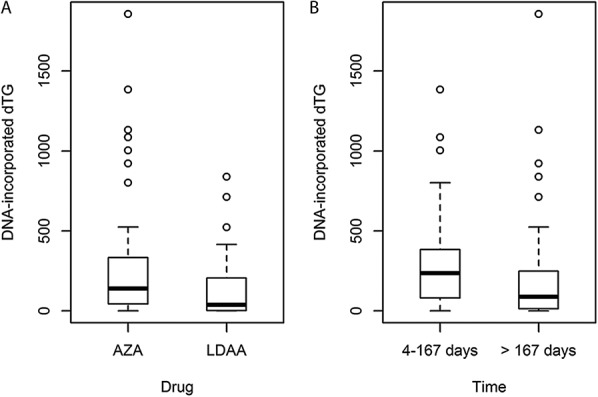
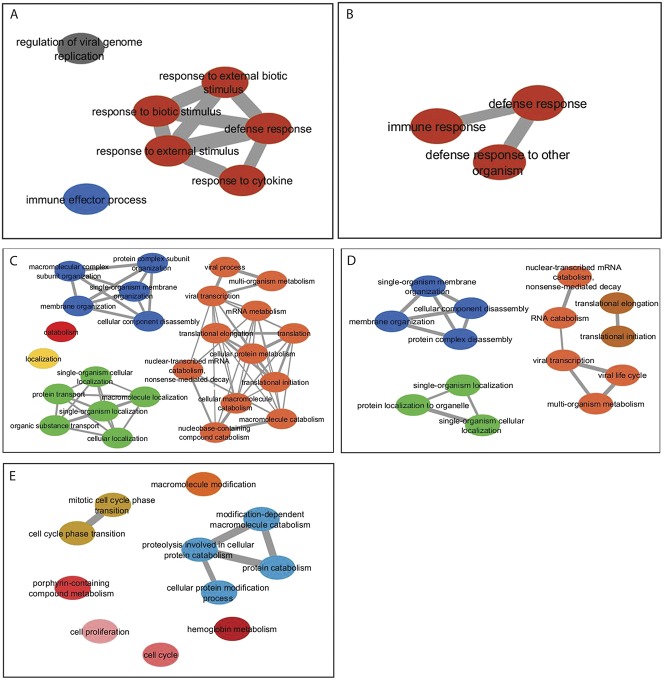
Results: There were no differences in reduction of white-cell counts between the 2 treatment groups, but patients on LDAA had lower DNA-incorporated deoxythioguanosine than those on AZA; for both groups, incorporated deoxythioguanosine was lower in patients on thiopurines for 24 weeks or more (maintenance of remission) compared to patients treated for less than 24 weeks (achievement of remission). Patients on LDAA had higher levels of red-blood cell thioguanine nucleotides than those on AZA, but there was no correlation between these or their methylated metabolites, and incorporated deoxythioguanosine. Transcriptome analysis suggested down-regulation of immune responses consistent with effective immunosuppression in patients receiving LDAA, with evidence for different mechanisms of action between the 2 therapies.

Conclusions: LDAA is biologically effective despite lower deoxythioguanosine incorporation into DNA, and has different mechanisms of action compared to standard-dose azathioprine.


Conflict of interest statement

The authors have no conflict of interest to disclose.

Figures

FIGURE 1.
FIGURE 1.
Schematic outline of thiopurine metabolism. Azathioprine is nonenzymatically cleaved to 6-MP which is metabolized by the enzymes (blue text) inosine-monophosphate dehydrogenase (IMPDH), thiopurine methyltransferase (TPMT), hypoxanthine-guanine phosphoribosyl transferase (HGPRT), inosine tri-phosphatase (ITPase) and guanosine monophosphate synthetase (GMPS). MeMP, methylmercaptopurine; TIMP, thioinosine monophosphate with metabolism to the di- and triphosphates TIDP and TITP, respectively; TXMP, thioxanthine monophosphate; TGMP, thioguanosine monophosphate with metabolism to the di- and triphosphates TGDP and TGTP, respectively, and incorporation into DNA. 6-MP is inactivated by metabolism to thioxanthine then thiouric acid via xanthine oxidase (XO), which is inhibited by allopurinol. Thioxanthine may inhibit TPMT. The molecular mechanism of TGN immunosuppression may include G-protein (rac-1) inhibition.
FIGURE 2.
FIGURE 2.
Changes in white blood-cell counts (A), neutrophil counts (B), and levels of dTGDNA (C) in newly diagnosed patients at 12 weeks after therapy with AZA or LDAA. The data show a significant reduction in mean white-cell and neutrophil counts (neutrophils in brackets) from 9.3 (6.4) to 6.6 (4.4) as a result of therapy with AZA or LDAA (n = 18; one-sample t-test on difference per patient, P ≤ 0.001), but no significant difference between the AZA or LDAA treatments (t-test; P ≥ 0.64). However, there were significantly lower dTGDNA levels in the LDAA group (Mann–Whitney Rank Sum Test, Z = 2.21, P = 0.03). Units: neutrophil and white blood-cell counts × 109/L; dTGDNA, moles dTG/106 moles dA.
FIGURE 3.
FIGURE 3.
A, Box and whisker plot of data for dTGDNA in the AZA and LDAA treatment groups for all patients in the study and sampled at different periods on therapy. For AZA (all sites) median dTGDNA was 139.6 (mean 241.5, range 0–1857, SD 310.7, n = 97) and for LDAA-treated patients (ESH) 37.6 (mean 128.8, range 0–839.3, SD 184.5, n = 48). For comparison, AZA-treated patients at ESH alone had median dTGDNA 173.1 (mean 308.7, range 0–1384.5, SD 399.4, n = 27). B, Box and whisker plot for dTGDNA in 2 time periods: 4 to 167 days (∼≤ 24 wk) and > 167 days (>24 wk), representing time to achievement of remission, and maintenance of remission. Initial assessment of dTGDNA by time periods at 4 to 83, 84 to 167, 168 to 252, or >252 days after initiation of therapy suggested a decrease after 167 days (see Fig. 1, Supplemental Digital Content 1, http://links.lww.com/IBD/B503); therefore, periods 1 and 2, and 3 and 4 were combined for analysis. The distributions of treatment times were similar for AZA and LDAA-treated patients. Units: dTGDNA, moles dTG/106 moles deoxyadenosine.
FIGURE 4.
FIGURE 4.
GO profiling from RNA-seq data for thiopurine-treated patients: (A) biological processes significantly associated with genes underexpressed as a consequence of LDAA therapy; (B) sampled (jack-knife: each patient excluded in turn) data, biological processes significantly associated with underexpressed genes in LDAA-treated patients which were common to all subsampled sets; (C) biological processes significantly associated with over-expressed genes in LDAA-treated patients; (D) biological processes significantly associated with overexpressed genes which were common to all subsampled sets of LDAA-treated patients; in A to D, the BH FDR was set to P < 0.001 for GO categories. E, GO profiling from RNA-seq data for AZA-treated patients, showing biological processes significantly associated with underexpressed genes (BH FDR was set to P < 0.05 for GO categories). No biological processes were significantly associated with increases in gene expression in response to AZA, but only the GO cell compartments “cell periphery” and “plasma membrane,” were significantly associated with increases in gene expression in response to AZA and these were common to all subsamples.

References

    1. Ansari A, Elliott T, Baburajan B, et al. Long-term outcome of using allopurinol co-therapy as a strategy for overcoming thiopurine hepatotoxicity in treating inflammatory bowel disease. Aliment Pharmacol Ther. 2008;28:734–741. - PubMed
    1. Ansari A, Patel N, Sanderson J, et al. Low-dose azathioprine or mercaptopurine in combination with allopurinol can bypass many adverse drug reactions in patients with inflammatory bowel disease. Aliment Pharmacol Ther. 2010;31:640–647. - PubMed
    1. Sparrow MP, Hande SA, Friedman S, et al. Effect of allopurinol on clinical outcomes in inflammatory bowel disease nonresponders to azathioprine or 6-mercaptopurine. Clin Gastro Hepatol. 2007;5:209–214. - PubMed
    1. Sparrow MP, Hande SA, Friedman S, et al. Allopurinol safely and effectively optimizes tioguanine metabolites in inflammatory bowel disease patients not responding to azathioprine and mercaptopurine. Aliment Pharmacol Ther. 2005;22:441–446. - PubMed
    1. Cuffari C, Theoret Y, Latour S, et al. 6-Mercaptopurine metabolism in Crohn's disease: correlation with efficacy and toxicity. Gut. 1996;39:401–406. - PMC - PubMed

Publication types

MeSH terms