. 2017 Apr 28;22(5):702.
doi: 10.3390/molecules22050702.

Protective Effect of Caffeic Acid Derivatives on tert-Butyl Hydroperoxide-Induced Oxidative Hepato-Toxicity and Mitochondrial Dysfunction in HepG2 Cells

Affiliations

Protective Effect of Caffeic Acid Derivatives on tert-Butyl Hydroperoxide-Induced Oxidative Hepato-Toxicity and Mitochondrial Dysfunction in HepG2 Cells

Tzung-Hsun Tsai et al. Molecules. .

Abstract

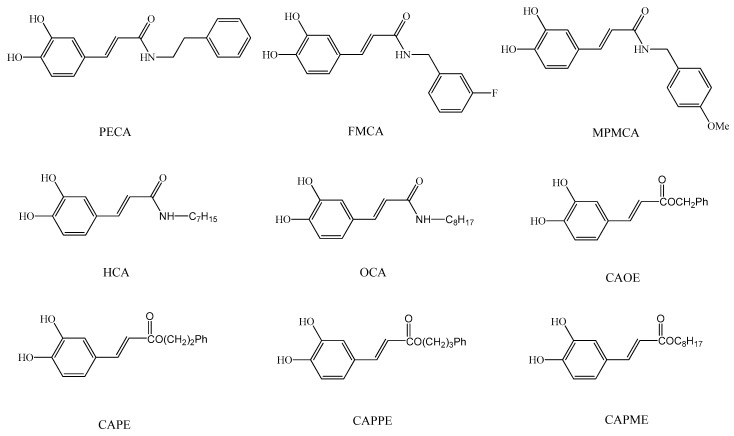
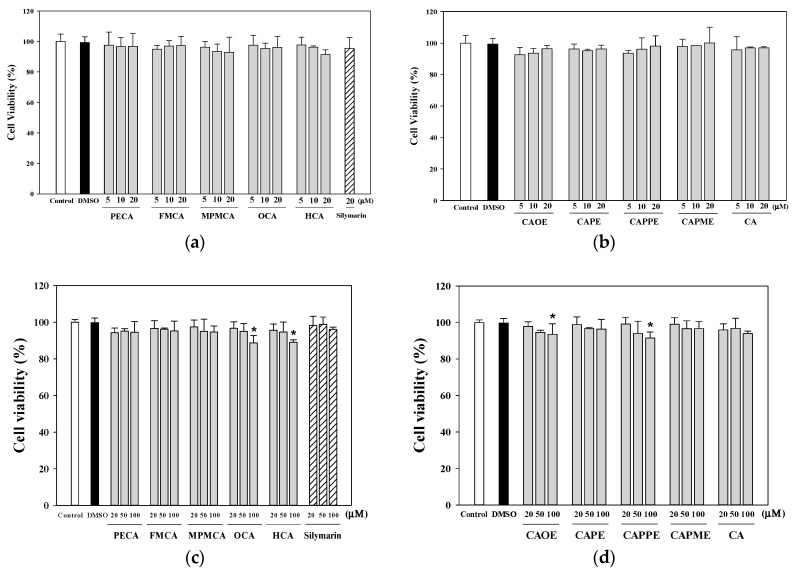
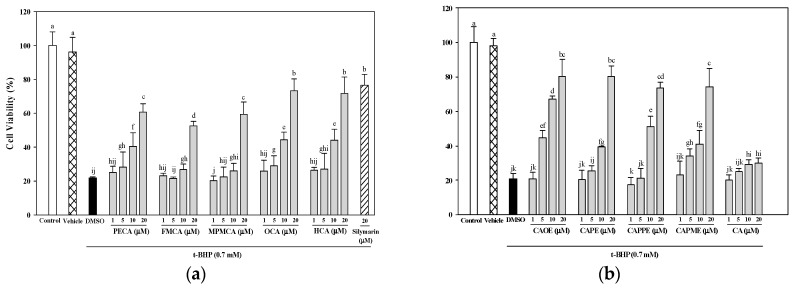
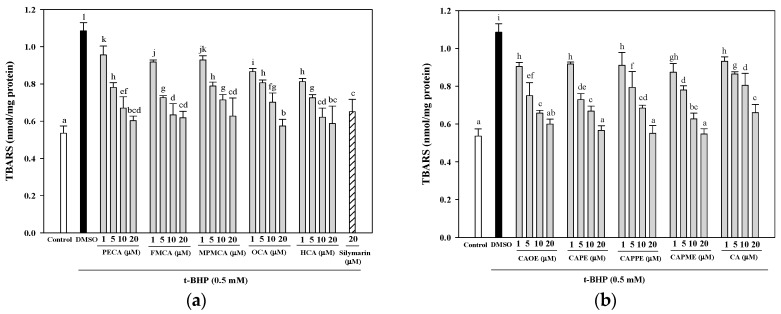
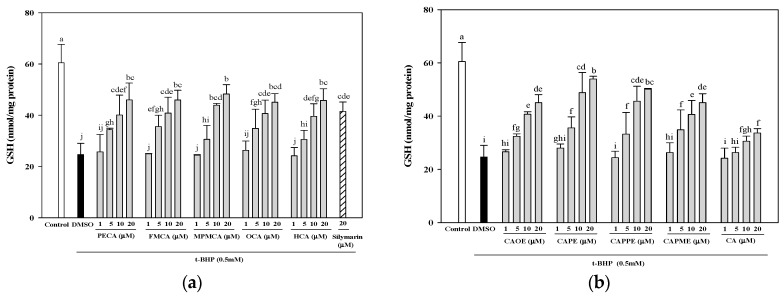
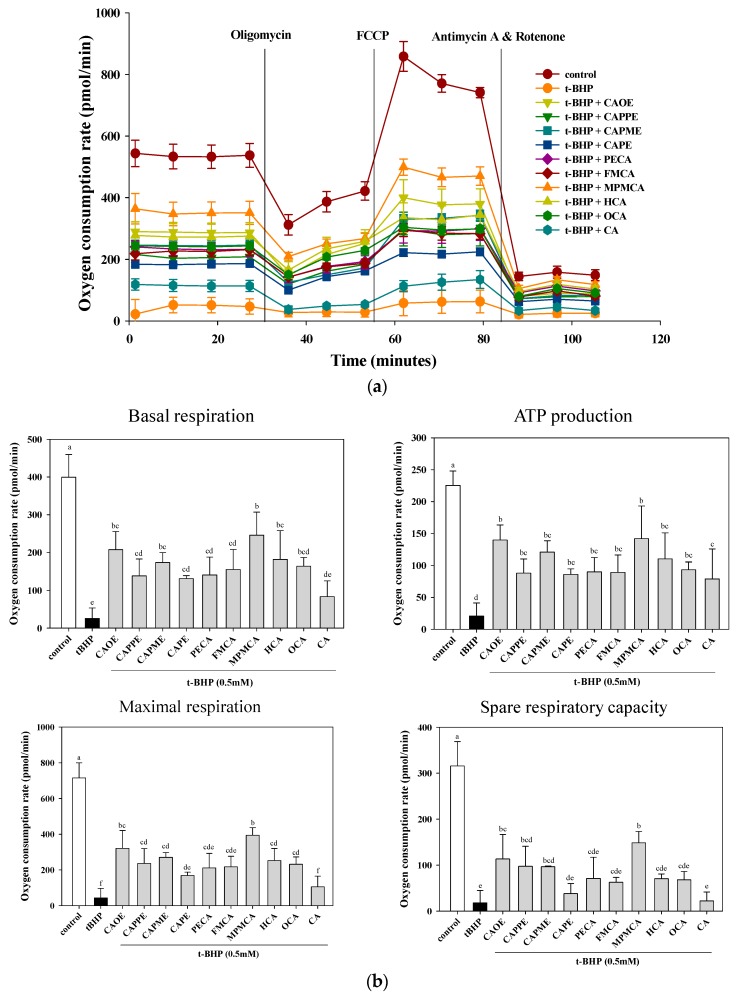
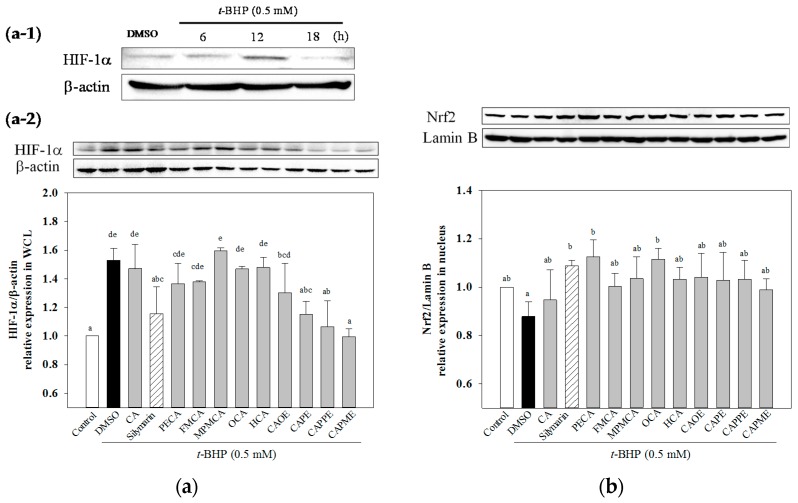
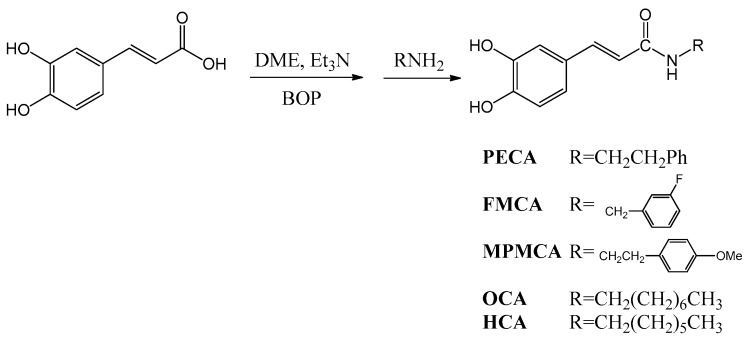
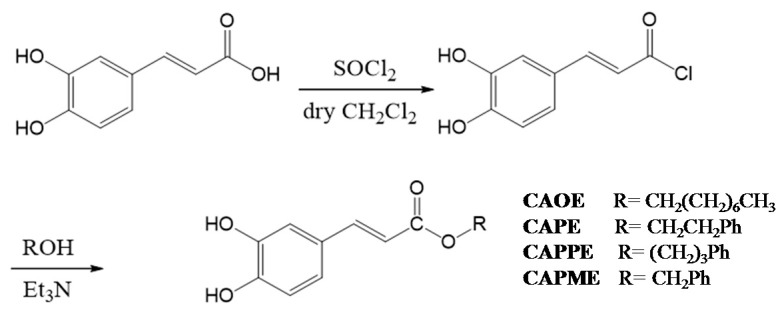
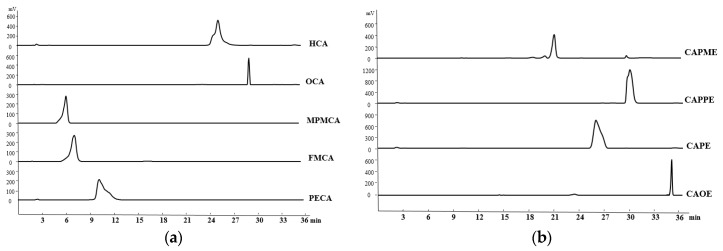
Oxidative stress results in structural and functional abnormalities in the liver and is thought to be a crucial factor in liver diseases. The aim of this study was to investigate the cytoprotective and antioxidant effects of caffeic acid (CA) derivatives on tert-butyl hydroperoxide (t-BHP)-induced oxidative stress in HepG2 cells. Nine CA derivatives were synthesized, including N-phenylethyl caffeamide (PECA), N-(3-florophen)methyl caffeamide (FMCA), N-(4-methoxy-phen)methyl caffeamide (MPMCA), N-heptyl caffeamide (HCA), N-octyl caffeamide (OCA), octyl caffeate (CAOE), phenpropyl caffeate (CAPPE), phenethyl caffeate (CAPE), and phenmethyl caffeate (CAPME). The results showed that CA and its derivatives significantly inhibited t-BHP-induced cell death of HepG2 cells. The rank order of potency of the CA derivatives for cytoprotection was CAOE > HCA > OCA > FMCA > CAPPE > CAPME > CAPE > PECA > MPMCA > CA. Their cytoprotective activity was associated with lipophilicity. The antioxidant effect of these compounds was supported by the reduction in the levels of thiobarbituric acid reactive substrates, a biomarker of lipid peroxidation, in HepG2 cells. Pre-treatment of CA derivatives significantly prevented the depletion of glutathione, the most important water-soluble antioxidant in hepatocytes. Pre-treatment of CA derivatives before t-BHP exposure maintained mitochondrial oxygen consumption rate and ATP content in the injured HepG2 cells. CA derivatives except OCA and HCA significantly suppressed t-BHP-induced hypoxia-inducible factor-1α (HIF-1α) protein level. In addition, all of these CA derivatives markedly increased the nuclear factor erythroid 2-related factor 2 (Nrf2) accumulation in the nucleus, indicating that their cytoprotection may be mediated by the activation of Nrf2. Our results suggest that CA derivatives might be a hepatoprotective agent against oxidative stress.

Keywords: antioxidant; caffeic acid derivatives; liver protection; tert-butyl hydroperoxide.


Conflict of interest statement

The authors declare no conflict of interest.

Figures

Figure 1
Figure 1
Chemical structures of caffeic acid derivatives.
Figure 2
Figure 2
Effect of caffeic acid derivatives on HepG2 cell viability. HepG2 cells were treated with different concentration of samples for 24 h (a,b) and 72 h (c,d). Cell viability is expressed as the percentage of vehicle control (0.1% DMSO). Control, medium alone without DMSO. Values were shown as mean ± SD (n = 3). *, p < 0.05 vs. DMSO-vehicle.
Figure 3
Figure 3
Protective effects of caffeic acid derivatives of t-BHP-induced cytotoxicity. HepG2 cells were treated with different concentrations of caffeamide derivatives (a) and caffeate derivatives (b) for 24 h before being exposed to t-BHP (0.7 mM) for 20 h. The vehicle and positive controls respectively received DMSO (0.1%) and silymarin (20 μM). Cell viability is expressed as the percentage of control. Values were shown as mean ± SD (n = 3). Data were analyzed by one-way ANOVA and Duncan multiple comparison test. Values not sharing the same letter are significantly different at p < 0.05.
Figure 4
Figure 4
Inhibitory effects of caffeic acid derivatives on t-BHP-induced lipid peroxidation in HepG2 cells. Pre-treatment with caffeamide derivatives (a) and caffeate derivatives (b) for 24 h, HepG2 cells were stimulated with t-BHP (0.5 mM) for 24 h. The vehicle and positive controls respectively received DMSO (0.1%) and silymarin (20 μM). The amount of TBARS formation is expressed as nmol/mg protein. Values were shown as mean ± SD (n = 3). Data were analyzed by one-way ANOVA and Duncan multiple comparison test. Values not sharing the same letter are significantly different at p < 0.05.
Figure 5
Figure 5
Effects of caffeic acid derivatives on the glutathione levels in HepG2 cells after the oxidative damage induced by t-BHP. Pre-treatment with caffeamide derivatives (a) and caffeate derivatives (b) for 24 h, HepG2 cells were stimulated with t-BHP (0.5 mM) for 24 h. The vehicle and positive controls respectively received DMSO (0.1%) and silymarin (20 μM). The amount of cellular glutathione level is expressed as nmol/mg protein. Values were shown as mean ± SD (n = 3). Data were analyzed by one-way ANOVA and Duncan multiple comparison test. Values not sharing the same letter are significantly different at p < 0.05.
Figure 6
Figure 6
Effect of CA derivatives on t-BHP-induced mitochondria dysfunction. HepG2 cells were treated with CA and CA derivatives (20 μM) or control (vehicle, 0.1% DMSO) for 6 h, followed by 0.5 mM t-BHP for an additional 2 h. Respiration curve (a) and statistical analyses of basal, maximal and spare mitochondrial respiration capacity, and ATP production (b) were analyzed. Values were shown as mean ± SD (n = 3). Data were analyzed by one-way ANOVA and Duncan multiple comparison test. Values not sharing the same letter are significantly different at p < 0.05.
Figure 7
Figure 7
Effect of CA derivatives on HIF-1α and Nrf2 protein levels in t-BHP-treated HepG2 cells. Cells were treated with t-BHP (0.5 mM) alone for the indicated times (a-1). Pre-treatment with test compounds (20 μM) for 24 h, cells were then stimulated with t-BHP (0.5 mM) for 12 h (a-2). The equal amounts of whole cell lysate (WCL) were subjected to immunoblotting to determine the HIF-1α level. Quantification of protein levels was normalized to β-actin (a). Pre-treatment with test compounds (20 μM) for 24 h, cells were treated with t-BHP (0.5 mM) for 12 h. Then, equal amounts of nuclear protein were subjected to western blot analysis to determine the Nrf2 level. Quantification of protein levels was normalized to lamin B (b). The vehicle and positive controls respectively received DMSO (0.1%) and silymarin (20 μM). Results were expressed as mean ± SD of three experiments. Data were analyzed by one-way ANOVA and Duncan multiple comparison test. Values not sharing the same letter are significantly different at p < 0.05.
Scheme 1
Scheme 1
Synthesis of caffeic acid amide derivatives.
Scheme 2
Scheme 2
Synthesis of caffeic acid ester derivatives.
Figure 8
Figure 8
Retention time and purity analysis of caffeamide derivatives (a) and caffeate derivatives (b) by HPLC.

Similar articles

Cited by

References

    1. Muriel P. Role of free radicals in liver diseases. Hepatol. Int. 2009;3:526–536. doi: 10.1007/s12072-009-9158-6. - DOI - PMC - PubMed
    1. Cichoż-Lach H., Michalak A. Oxidative stress as a crucial factor in liver diseases. World J. Gastroenterol. 2014;20:8082–8091. doi: 10.3748/wjg.v20.i25.8082. - DOI - PMC - PubMed
    1. Ivanov A.V., Valuev-Elliston V.T., Tyurina D.A., Ivanova O.N., Kochetkov S.N., Bartosch B., Isaguliants M.G. Oxidative stress, a trigger of hepatitis C and B virus-induced liver carcinogenesis. Oncotarget. 2017;8:3895–3932. doi: 10.18632/oncotarget.13904. - DOI - PMC - PubMed
    1. Medvedev R., Ploen D., Hildt E. HCV and Oxidative Stress: Implications for HCV life cycle and HCV-associated pathogenesis. Oxid. Med. Cell. Longev. 2016;2016:9012580. doi: 10.1155/2016/9012580. - DOI - PMC - PubMed
    1. Li S., Tan H.Y., Wang N., Zhang Z.J., Lao L., Wong C.W., Fen Y. The role of oxidative stress and antioxidants in liver diseases. Int. J. Mol. Sci. 2015;16:26087–26124. doi: 10.3390/ijms161125942. - DOI - PMC - PubMed

MeSH terms