. 2017 Apr 28:3:17056.
doi: 10.1038/nplants.2017.56.

Nanoscale movements of cellulose microfibrils in primary cell walls

Affiliations

Nanoscale movements of cellulose microfibrils in primary cell walls

Tian Zhang et al. Nat Plants. .

Erratum in

Abstract

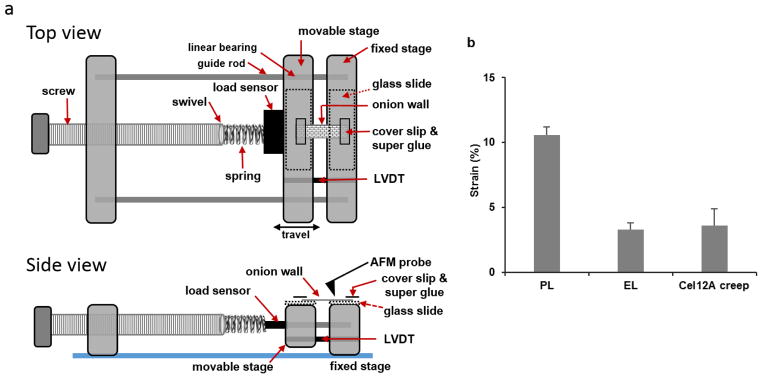
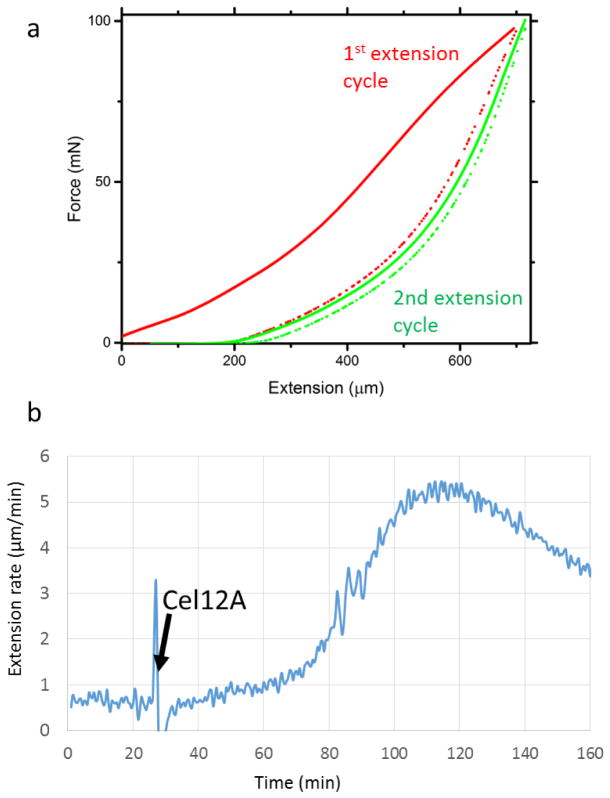
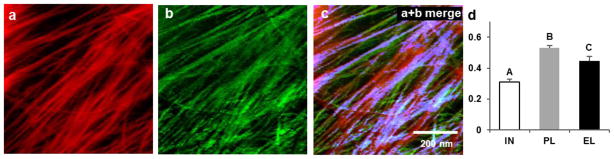
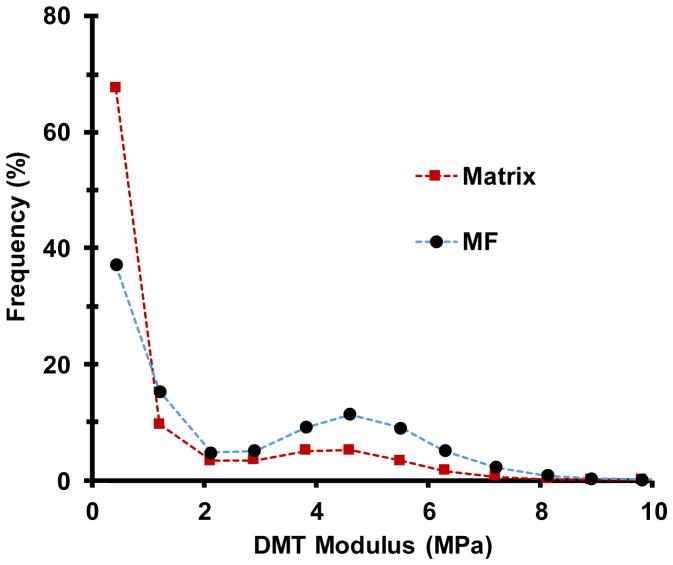
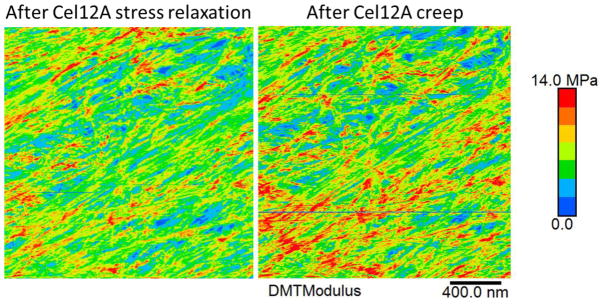
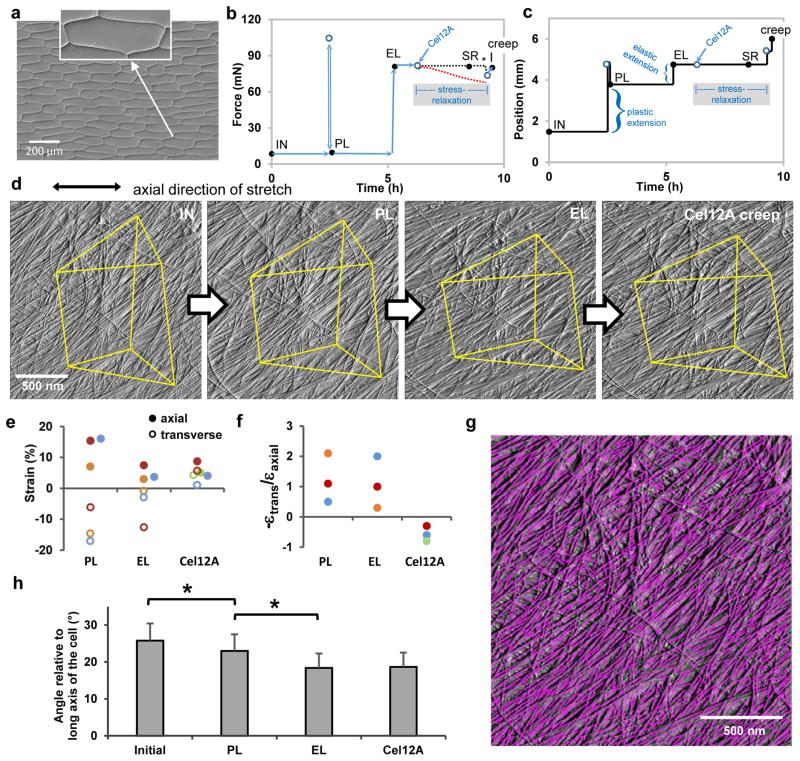
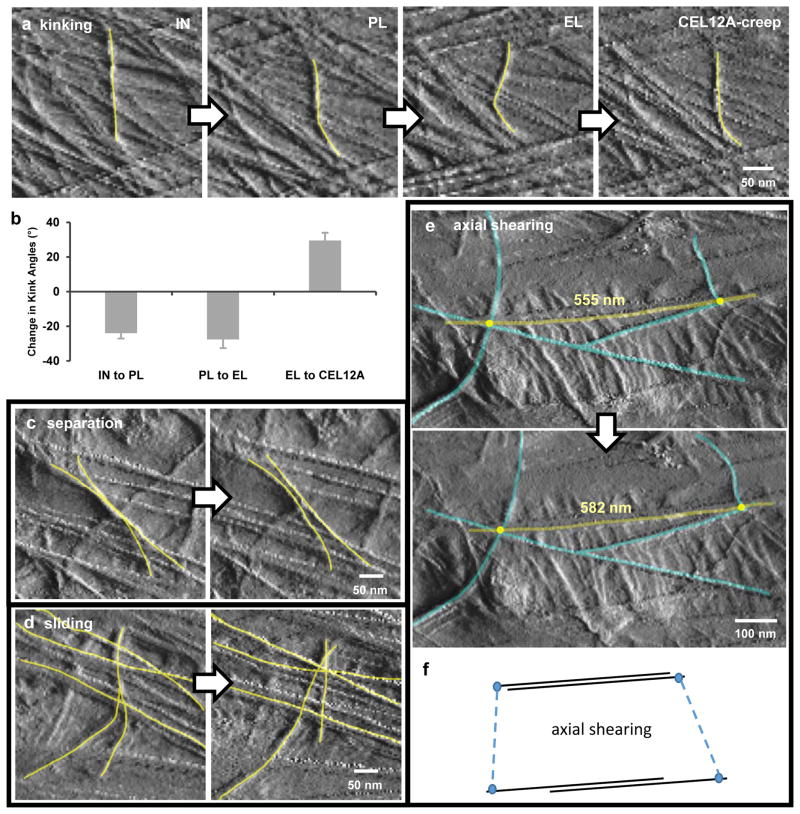
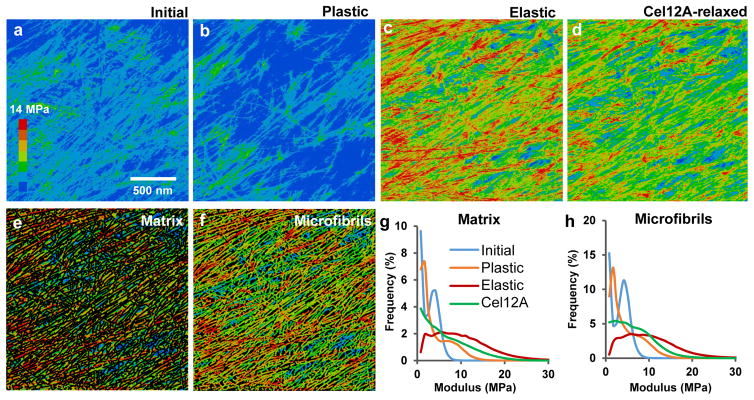
The growing plant cell wall is commonly considered to be a fibre-reinforced structure whose strength, extensibility and anisotropy depend on the orientation of crystalline cellulose microfibrils, their bonding to the polysaccharide matrix and matrix viscoelasticity1-4. Structural reinforcement of the wall by stiff cellulose microfibrils is central to contemporary models of plant growth, mechanics and meristem dynamics4-12. Although passive microfibril reorientation during wall extension has been inferred from theory and from bulk measurements13-15, nanometre-scale movements of individual microfibrils have not been directly observed. Here we combined nanometre-scale imaging of wet cell walls by atomic force microscopy (AFM) with a stretching device and endoglucanase treatment that induces wall stress relaxation and creep, mimicking wall behaviours during cell growth. Microfibril movements during forced mechanical extensions differ from those during creep of the enzymatically loosened wall. In addition to passive angular reorientation, we observed a diverse repertoire of microfibril movements that reveal the spatial scale of molecular connections between microfibrils. Our results show that wall loosening alters microfibril connectivity, enabling microfibril dynamics not seen during mechanical stretch. These insights into microfibril movements and connectivities need to be incorporated into refined models of plant cell wall structure, growth and morphogenesis.


Conflict of interest statement

The authors declare no competing financial interests.

Figures

Extended Data Figure 1
Extended Data Figure 1. Extensometer design and axial extension of onion walls
a, Schematic design of the AFM extensometer. Glass slides (75 mm × 25 mm) were fixed on top of the Plexiglas stages to provide a smooth, flat surface to support the wall specimen. Extension was measured by a linear variable differential transformer (LVDT, Microstrain NC-DVRT-2.5; LORD Corp.) attached to the movable stage whose displacement was controlled by a screw, connected to the stage by a spring and a load sensor (LSB200; Futek Inc.) that measured the tensile force applied to the wall. A swivel connects the spring to the screw, allowing the screw to rotate freely. Position and force were recorded with a USB Data Acquisition Module and QuickDAQ software (Data Translation). The positions at selected time points were used to calculate whole-wall strains. At high holding forces, the moveable stage tended to bind or lock in position. This locking feature was used to implement stress relaxation conditions (constant holding length) prior to addition of Cel12A. At the end of the relaxation period, the binding of the movable stage was gently released, coupling position and force again (and resulting in slight wall extension and restoration of nominal holding force). For AFM measurements the AFM probe was lowered onto the PCW surface ~7 mm from the glued coverslip on the fixed stage. b, Average axial strains of onion epidermal strips measured by the position sensor: PL: plastic initial length; EL: elastic plastic length; Cel12A creep: length after Cel12A creep elastic length. Error bar = SE, n=3.
Extended Data Figure 2
Extended Data Figure 2. Representative macroscopic behavior of onion epidermal cell wall strips during two force-extension cycles (a) and after endoglucanase Cel12A addition in a constant-force creep experiment (b)
(a) shows that the second extension is reversible (elastic) and the first extension results in plastic extension (approximately 200 μm in this example). Force-extension curves of this type are typical of primary cell walls. (b) shows that addition of Cel12A stimulated onion wall creep after a lag of 30–40 min. Similar creep responses were reported for cucumber and Arabidopsis walls. Experimental conditions: Onion epidermal wall strips (3 mm wide) were prepared as described in Methods (including 10-s heat inactivation), and incubated in 20 mM sodium acetate buffer, pH 4.5. In (a) the wall strip (3 mm between clamps) was stretched in two cycles at a rate of 3 mm/min until a holding force of 98 mN was reached. In (b) the epidermal was clamped at a constant force of 98 mN. At the time indicated by the arrow the buffer was exchanged for one containing 1 μg/mL Cel12A. These two experiments were carried out at least 3 times with similar results.
Extended Data Figure 3
Extended Data Figure 3. Increased correlation between height and modulus values after plastic and elastic extensions
a, A height map (false colored red) collected simultaneously with b, a DMT modulus map (false colored green). Height maps of these cell walls emphasize microfibrils over matrix, so height correlates with the probability that a pixel is located on a microfibril. c, Merged a and b maps generated by co-localization with RG2B an ImageJ plugin, (http://rsb.info.nih.gov/ij/plugins/rg2bcolocalization.html), with co-localization indicated in lavender. d, Pearson’s Correlation Coefficient between modulus and height values at initial, plastic and elastic points in the extension series. The images were split into nine grids for larger statistical sampling. Means with different letters (A, B, C) indicate significant differences (One way ANOVA followed by Tukey test, P < 0.01, n = 27). Correlation increased after plastic extension and decreased during elastic extension, indicating the matrix is softer after the first extension, leading to more prominent microfibril features in the modulus map. The Pearson’s correlation coefficient was calculated by JACoP, an ImageJ plugin (https://imagej.nih.gov/ij/plugins/track/jacop.html).
Extended Data Figure 4
Extended Data Figure 4. Distribution of indentation modulus for pixels assigned to microfibril and matrix categories, for an unstretched (initial) onion cell wall
The complete histogram shows the frequency of DMT modulus values (bin size = 0.78 MPa) for a single image measured by Bruker Nanoscope software. The dotted lines are provided for graphical use and not intended to imply a continuous variable. Points are plotted at the midpoint of each bin interval. This distribution is representative of three images.
Extended Data Figure 5
Extended Data Figure 5. Comparison of indentation modulus maps of the same onion wall surface after Cel12A stress relaxation (left) and Cel12A creep (right)
The higher modulus in the right image is a result of restoring of the wall holding force to the original value of 80 mN. Representative of three replicates.
Figure 1
Figure 1. Microfibril reorientations during different modes of cell wall extension
a, Light micrograph (differential interference contrast) of a peeled epidermal wall of onion scale, showing cell outlines. Peeling tears open the cells, leaving only the outer wall. We probed the cell side of the wall by AFM. Inset shows that the cell wall makes tight connections to neighboring cells. Residues of the anticlinal (side) walls are visible as short triangular flanges. b-c, Wall extension protocol showing coupled changes in force (b) and length (c) of wall specimen. AFM images were made at the five points indicated by the black circles: initial (IN, unstretched wall); after plastic (PL) extension; after elastic (EL) extension; after stress relaxation (SR) induced by treatment with Cel12A while cell wall length was held constant (period indicated by the shaded box); and after the cell wall was freed to extend (creep). During stress relaxation the force sensor registers the force applied to the locked movable stage (blacked dotted line), not the force borne by the wall sample which is approximated by the red dotted line (see Methods). At the end of the stress relaxation period, the movable stage is freed to move (*) and the sensor registers the actual force borne by the cell wall. The extensometer is then manually adjusted to restore the elastic holding force to its value before the addition of Cel12A. This accounts for the two closely-spaced points prior to the acquisition of the creep image. d, AFM Peakforce error images showing the same wall surface at four points in the extension series (the Cel12A-relaxed SR image is omitted because it is nearly identical to the elastic EL image; see Extended Data Movie 1). Yellow lines connect stable fiducial marks. e, Average axial and transverse strains measured from distances between 5–10 pairs of vertices (SEMs are 0.2 – 1.8 % strain). Colors are used to match experiment sets; axial strains denoted with solid circles, transverse strain with open circles. Points are offset laterally to improve visibility. f, Negative strain ratios for the three sets of experiments shown in (e). g, Automated detection of microfibrils with SOAX software; ‘snakes’ are colored magenta. h, Mean orientation of snakes (microfibril fragments) at four points in the extension protocol, for three experiments. Error bar = SEM, n = 3. Significant difference at P<0.05 indicated with *.
Figure 2
Figure 2. Diversity of individual microfibril movements during cell wall extension
a, AFM Peakforce error images showing the dynamics of microfibril kinking during four points in the extension series. b, Average changes in kink angles between consecutive points in the extension series. Error bar = SEM, 28 ≤ n ≤ 41 from three replicate experiments. All means are significantly different from zero. c, An example of lateral separation of two microfibrils during elastic extension. Note that axially-oriented microfibrils draw closer together, correlating with transverse compression. d, An example of independent motions (sliding and separation) of microfibrils in adjacent lamellae during Cel12A-creep. e, An example of axial shearing (side-by-side gliding) of microfibrils during elastic extension. f, Diagram to clarify axial shearing of microfibrils. In a, c, d and e, yellow lines were added to highlight microfibrils of interest. These four classes of motions were observed during plastic, elastic and Cel12A-induced movements.
Figure 3
Figure 3. Modulus maps of cell wall surface after different modes of extension
a–d, Heat maps of indentation modulus of the cell wall surface at four points in the extension series, collected in Peakforce tapping mode simultaneously with the images in Figure 1d. Color scale at left (step size = 2 MPa). Note that the modulus of axially aligned microfibrils is particularly reduced after Cel12A relaxation, indicating nonhomogeneous stress relaxation at the nanoscale. Modulus values increase when the holding force is restored (Extended Data Figure 5). e, Modulus map of the matrix component of the image in c, obtained by blacking out microfibrils identified with SOAX. f, Modulus map of the microfibril component of the image in c, identified by SOAX software. g, Histograms of the modulus distribution for the matrix for images a–d. h, Histograms of the modulus distribution for the microfibrils during four extension points shown in a–d. Note the y-axes in g and h differ by a factor of two and that values of 0–1 MPa are not graphed because of scaling issues; see Extended Data Figure 4 for an example of the complete distribution). This experiment was replicated three times with similar results. IN: Initial; PL: Plastic; EL: Elastic.

Comment in

References

    1. Burton RA, Gidley MJ, Fincher GB. Heterogeneity in the chemistry, structure and function of plant cell walls. Nature Chem Biol. 2010;6:724–732. doi: 10.1038/nchembio.439. - DOI - PubMed
    1. Baskin TI. Anisotropic expansion of the plant cell wall. Annu Rev Cell Dev Biol. 2005;21:203–222. doi: 10.1146/annurev.cellbio.20.082503.103053. - DOI - PubMed
    1. Cosgrove DJ. Growth of the plant cell wall. Nature Reviews. Molecular Cell Biology. 2005;6:850–861. doi: 10.1038/nrm1746. - DOI - PubMed
    1. Bidhendi AJ, Geitmann A. Relating the mechanics of the primary plant cell wall to morphogenesis. J Exp Bot. 2016;67:449–461. doi: 10.1093/jxb/erv535. - DOI - PubMed
    1. Louveaux M, Julien JD, Mirabet V, Boudaoud A, Hamant O. Cell division plane orientation based on tensile stress in Arabidopsis thaliana. Proc Natl Acad Sci U S A. 2016;113:E4294–4303. doi: 10.1073/pnas.1600677113. - DOI - PMC - PubMed

Publication types