

The albatross plot: A novel graphical tool for presenting results of diversely reported studies in a systematic review
- PMID: 28453179
- PMCID: PMC5599982
- DOI: 10.1002/jrsm.1239
The albatross plot: A novel graphical tool for presenting results of diversely reported studies in a systematic review
Abstract
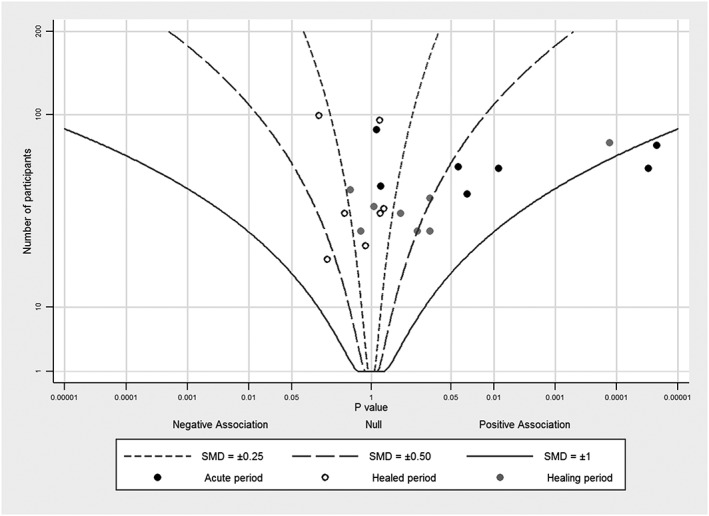
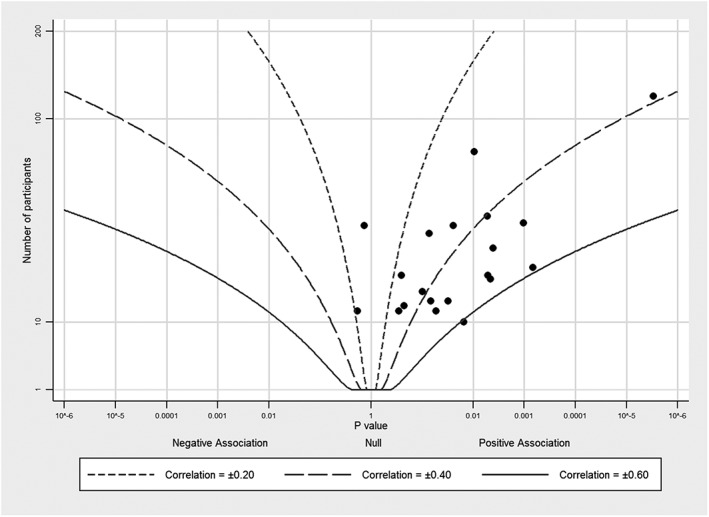
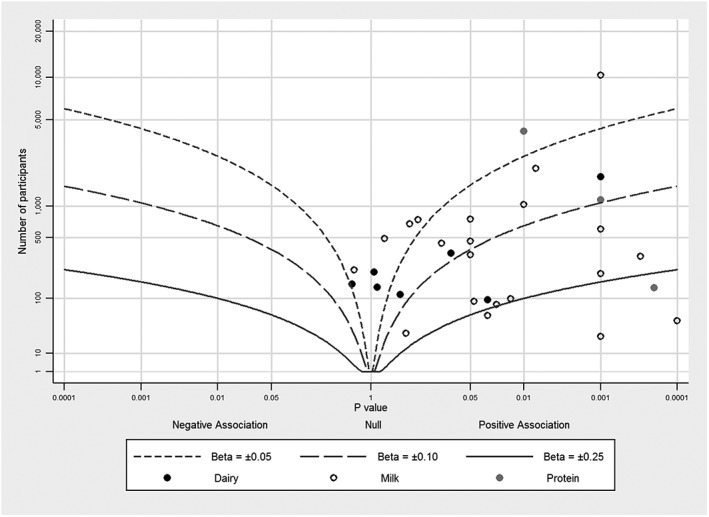
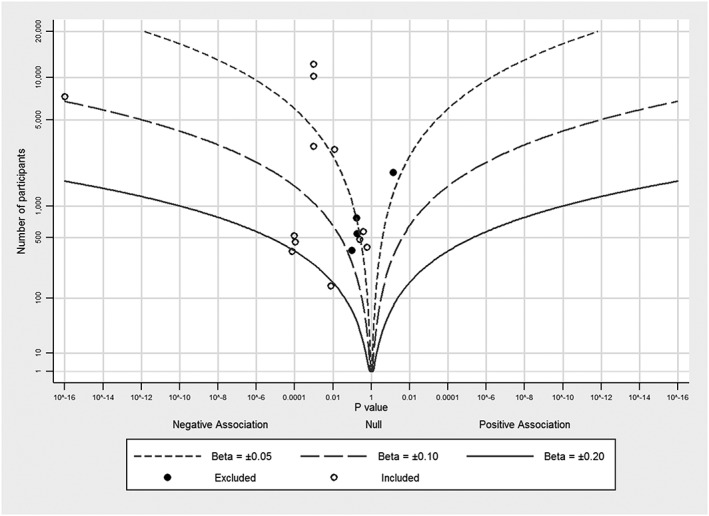
Meta-analyses combine the results of multiple studies of a common question. Approaches based on effect size estimates from each study are generally regarded as the most informative. However, these methods can only be used if comparable effect sizes can be computed from each study, and this may not be the case due to variation in how the studies were done or limitations in how their results were reported. Other methods, such as vote counting, are then used to summarize the results of these studies, but most of these methods are limited in that they do not provide any indication of the magnitude of effect. We propose a novel plot, the albatross plot, which requires only a 1-sided P value and a total sample size from each study (or equivalently a 2-sided P value, direction of effect and total sample size). The plot allows an approximate examination of underlying effect sizes and the potential to identify sources of heterogeneity across studies. This is achieved by drawing contours showing the range of effect sizes that might lead to each P value for given sample sizes, under simple study designs. We provide examples of albatross plots using data from previous meta-analyses, allowing for comparison of results, and an example from when a meta-analysis was not possible.
Keywords: evidence synthesis; graphical tool; methodology; systematic review.
Copyright © 2017 The Authors. Research Synthesis Methods Published by John Wiley & Sons Ltd.
Figures
References
-
- Borenstein M, Hedges LV, Higgins JPT, Rothstein HR. Introduction to Meta‐Analysis. Wiley; 2008.
-
- Friedman L. Why vote‐count reviews don't count. Biol Psychiatry. 2001;49:161‐162.
-
- Fisher RA. Statistical Methods for Research Workers. Edinburgh: Oliver and Boyd; 1925.
MeSH terms
Grants and funding
LinkOut - more resources
Full Text Sources
Other Literature Sources
