

A mass graph-based approach for the identification of modified proteoforms using top-down tandem mass spectra
- PMID: 28453668
- PMCID: PMC5860502
- DOI: 10.1093/bioinformatics/btw806
A mass graph-based approach for the identification of modified proteoforms using top-down tandem mass spectra
Abstract
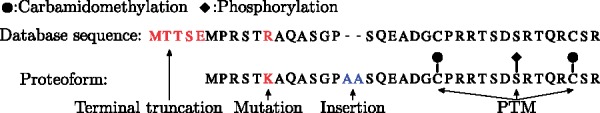
Motivation: Although proteomics has rapidly developed in the past decade, researchers are still in the early stage of exploring the world of complex proteoforms, which are protein products with various primary structure alterations resulting from gene mutations, alternative splicing, post-translational modifications, and other biological processes. Proteoform identification is essential to mapping proteoforms to their biological functions as well as discovering novel proteoforms and new protein functions. Top-down mass spectrometry is the method of choice for identifying complex proteoforms because it provides a 'bird's eye view' of intact proteoforms. The combinatorial explosion of various alterations on a protein may result in billions of possible proteoforms, making proteoform identification a challenging computational problem.
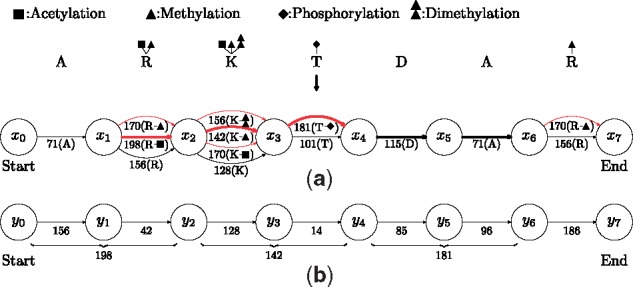
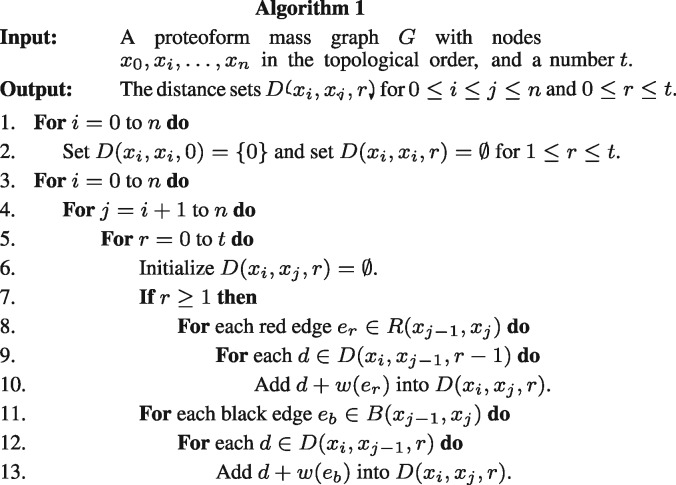
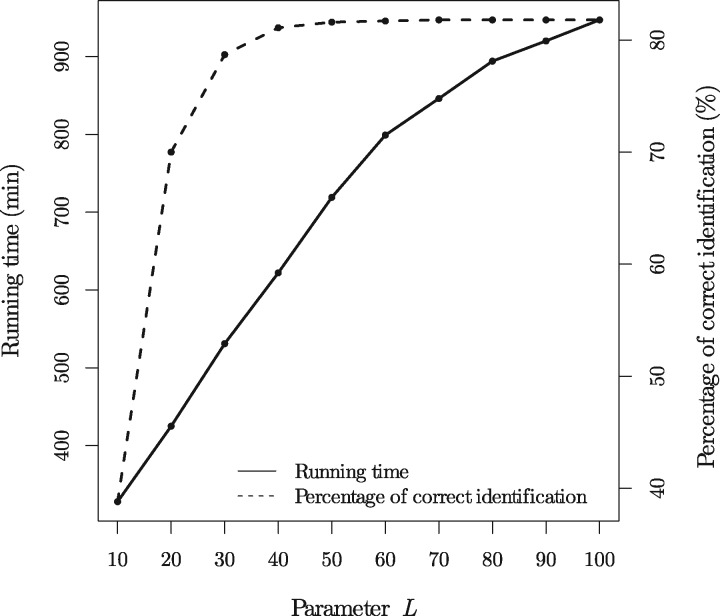
Results: We propose a new data structure, called the mass graph, for efficient representation of proteoforms and design mass graph alignment algorithms. We developed TopMG, a mass graph-based software tool for proteoform identification by top-down mass spectrometry. Experiments on top-down mass spectrometry datasets showed that TopMG outperformed existing methods in identifying complex proteoforms.
Availability and implementation: http://proteomics.informatics.iupui.edu/software/topmg/.
Contact: xwliu@iupui.edu.
Supplementary information: Supplementary data are available at Bioinformatics online.
© The Author 2016. Published by Oxford University Press. All rights reserved. For Permissions, please e-mail: journals.permissions@oup.com
Figures
Similar articles
-
Identification and Quantification of Proteoforms by Mass Spectrometry.Proteomics. 2019 May;19(10):e1800361. doi: 10.1002/pmic.201800361. Proteomics. 2019. PMID: 31050378 Free PMC article. Review.
-
TopPIC: a software tool for top-down mass spectrometry-based proteoform identification and characterization.Bioinformatics. 2016 Nov 15;32(22):3495-3497. doi: 10.1093/bioinformatics/btw398. Epub 2016 Jul 16. Bioinformatics. 2016. PMID: 27423895 Free PMC article.
-
Systematic Evaluation of Protein Sequence Filtering Algorithms for Proteoform Identification Using Top-Down Mass Spectrometry.Proteomics. 2018 Feb;18(3-4):10.1002/pmic.201700306. doi: 10.1002/pmic.201700306. Epub 2018 Feb 6. Proteomics. 2018. PMID: 29327814 Free PMC article.
-
A graph-based approach for proteoform identification and quantification using top-down homogeneous multiplexed tandem mass spectra.BMC Bioinformatics. 2018 Aug 13;19(Suppl 9):280. doi: 10.1186/s12859-018-2273-4. BMC Bioinformatics. 2018. PMID: 30367573 Free PMC article.
-
Profiling proteoforms: promising follow-up of proteomics for biomarker discovery.Expert Rev Proteomics. 2014 Feb;11(1):121-9. doi: 10.1586/14789450.2014.878652. Expert Rev Proteomics. 2014. PMID: 24437377 Review.
Cited by
-
In situ mass spectrometry analysis of intact proteins and protein complexes from biological substrates.Biochem Soc Trans. 2020 Feb 28;48(1):317-326. doi: 10.1042/BST20190793. Biochem Soc Trans. 2020. PMID: 32010951 Free PMC article. Review.
-
Characterization of Proteoform Post-Translational Modifications by Top-Down and Bottom-Up Mass Spectrometry in Conjunction with Annotations.J Proteome Res. 2023 Oct 6;22(10):3178-3189. doi: 10.1021/acs.jproteome.3c00207. Epub 2023 Sep 20. J Proteome Res. 2023. PMID: 37728997 Free PMC article.
-
Identification of Splice Variants and Isoforms in Transcriptomics and Proteomics.Annu Rev Biomed Data Sci. 2023 Aug 10;6:357-376. doi: 10.1146/annurev-biodatasci-020722-044021. Annu Rev Biomed Data Sci. 2023. PMID: 37561601 Free PMC article. Review.
-
A graph-based filtering method for top-down mass spectral identification.BMC Genomics. 2018 Sep 24;19(Suppl 7):666. doi: 10.1186/s12864-018-5026-x. BMC Genomics. 2018. PMID: 30255788 Free PMC article.
-
Identification and Quantification of Proteoforms by Mass Spectrometry.Proteomics. 2019 May;19(10):e1800361. doi: 10.1002/pmic.201800361. Proteomics. 2019. PMID: 31050378 Free PMC article. Review.
References
MeSH terms
Substances
Grants and funding
LinkOut - more resources
Full Text Sources
Other Literature Sources
Miscellaneous
