. 2017 Jun:55:131-137.
doi: 10.1016/j.gaitpost.2017.03.018. Epub 2017 Mar 31.

Increased gait variability may not imply impaired stride-to-stride control of walking in healthy older adults: Winner: 2013 Gait and Clinical Movement Analysis Society Best Paper Award

Affiliations

Increased gait variability may not imply impaired stride-to-stride control of walking in healthy older adults: Winner: 2013 Gait and Clinical Movement Analysis Society Best Paper Award

Jonathan B Dingwell et al. Gait Posture. 2017 Jun.

Abstract

Older adults exhibit increased gait variability that is associated with fall history and predicts future falls. It is not known to what extent this increased variability results from increased physiological noise versus a decreased ability to regulate walking movements. To "walk", a person must move a finite distance in finite time, making stride length (Ln) and time (Tn) the fundamental stride variables to define forward walking. Multiple age-related physiological changes increase neuromotor noise, increasing gait variability. If older adults also alter how they regulate their stride variables, this could further exacerbate that variability. We previously developed a Goal Equivalent Manifold (GEM) computational framework specifically to separate these causes of variability. Here, we apply this framework to identify how both young and high-functioning healthy older adults regulate stepping from each stride to the next. Healthy older adults exhibited increased gait variability, independent of walking speed. However, despite this, these healthy older adults also concurrently exhibited no differences (all p>0.50) from young adults either in how their stride variability was distributed relative to the GEM or in how they regulated, from stride to stride, either their basic stepping variables or deviations relative to the GEM. Using a validated computational model, we found these experimental findings were consistent with increased gait variability arising solely from increased neuromotor noise, and not from changes in stride-to-stride control. Thus, age-related increased gait variability likely precedes impaired stepping control. This suggests these changes may in turn precede increased fall risk.

Keywords: Motor control; Older adults; Stepping; Variability; Walking.


Figures

Figure 1
Figure 1. Basic Stride Parameters
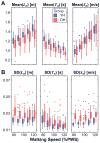
A: Box plots for stride length (Ln), time (Tn), and speed (Sn) for both young (YH) and older (OH) healthy adults walking at all 5 speeds (80% to 120% of preferred walking speed; PWS). Main effects for walking speed were all highly significant (all pSpd < 0.001). Older (OH) participants took shorter (Ln; pGrp = 0.021) and faster (Tn; pGrp < 0.001) strides than YH, but walked at the same speeds (Sn; pGrp = 0.569). B: Box plots for within-trial standard deviations for Ln, Tn, and Sn for both YH and OH groups walking at all 5 speeds. Significant differences between speeds were exhibited for Ln (pSpd = 0.022), Tn (pSpd < 0.001), and Sn (pSpd < 0.001). OH participants exhibited significantly greater variability than YH for all parameters: Ln (pGrp = 0.001), Tn (pGrp = 0.036), and Sn (pGrp < 0.001). In all plots, each box plot was constructed in the typical way: each box itself indicates median and inter-quartile range (IQR), each whisker is 1.5×IQR in length, and individual symbols (●) indicate data points lying outside this range.
Figure 2
Figure 2. Variability Relative to the GEM
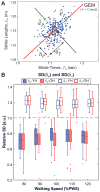
A: Schematic depiction of the definition of the Goal-Equivalent Manifold (GEM) for maintaining constant walking speed (v), shown in original units. All [T, L] combinations that lie exactly on the GEM (diagonal red line) achieve the exact same speed and thus equally satisfy the goal. Deviations tangent (δT) and perpendicular (δP) to the GEM (Eq. 2) are indicated for one representative data point. Fluctuations in δT that act along the GEM have no effect on achieving the goal to maintain constant speed. Fluctuations in δP that act perpendicular to the GEM do directly affect the goal and introduce errors with respect to maintaining constant speed. Normalizing Ln and Tn each to unit variance changes the numeric values \on the axes, but does not change how the data are structured with respect to each other in the [T, L] plane. B: Box plots of within-trial normalized standard deviations for δT (open boxes) and δP (filled boxes) for both YH and OH groups walking at all 5 speeds. Differences between δT and δP directions were highly statistically significant (pDir ≪ 0.0001). However, there were no significant differences either across speeds (pSpd = 0.970), or between YH and OH adults (pGrp = 0.520). These box plots were constructed in the same manner as in Fig. 1.
Figure 3
Figure 3. Stride-To-Stride Control
A: Schematic showing example calculation of DFA α exponents. Each time series shown has a standard deviation of 1. The strongly persistent time series (top) is consistent with being weakly controlled and yields a large value of large α. The approximately uncorrelated signal (bottom) is consistent with being strongly controlled and yields a much smaller value of α. B: Boxplots of DFA α exponents for Ln, Tn, and Sn for both YH and OH groups walking at all 5 speeds. Differences between speeds were statistically significant for Ln (pSpd = 0.038), but not for Tn (pSpd = 0.214) or Sn (pSpd = 0.498). There were no significant differences between OH and YH groups for any parameter: Ln (pGrp = 0.785), Tn (pGrp = 0.564) or Sn (pGrp = 0.982). C: Boxplots of DFA α exponents for δP and δT for both YH and OH groups walking at all 5 speeds. Differences between δP and δT directions were highly statistically significant (pDir ≪ 0.0001). However, there were no significant differences either across speeds (pSpd = 0.137), or between YH and OH groups (pGrp = 0.863). Thus, these healthy older adults (OH) appear to correct deviations in their stride-to-stride fluctuations in the same way and to the same degree as younger (YH) participants. In (B) and (C), box plots were constructed in the same manner as in Fig. 1.
Figure 4
Figure 4. Parameter Sensitivity Results for the Computational Model
Parameter sensitivity results obtained from simulations of our computational model for stride-to-stride control of stride variables (see Methods). Figure shows results for independently varying (AB) additive noise, (CD) multiplicative noise, and (EF) control gains in the model. All plots show mean parameter values with between-trial ±SD error bars. The error bars appear small because of the large number of trials (100 per condition) simulated. In plots (ACE), variability in δT, and δP are shown without first re-scaling L & T to unit variance (as was done in Fig 2B) to illustrate the changes in the raw magnitudes of variability across parameter variations. Increasing additive noise in the model yielded (A) increased variability of both stride variables (Ln, Tn, Sn) and GEM variables (δT, δP), but (B) no substantive changes in DFA α exponents. This is consistent with the notion that increasing neuromotor noise by itself leads to increased gait variability, but not changing the stride-to-stride control in the model leads to no changes in in DFA α exponents. Increasing multiplicative noise in the model yielded no substantive changes in either (C) the variability or (D) in DFA α exponents for any stride variables (Ln, Tn, Sn) or GEM variables (δT, δP). This was likewise consistent with the notion that increasing neuromotor noise, without changing the stride-to-stride control in the model, leads to no changes in DFA α exponents. Increasing the controller gains in the model yielded (E) small but somewhat inconsistent changes in variability of stride variables (Ln, Tn, Sn), but a consistent trend in the GEM variables for σ(δT) to decrease while σ(δP) increased, reflecting qualitative changes in how the variability was distributed relative to the GEM. Likewise, increasing these controller gains yielded (F) consistent and substantive decreases in DFA α exponents across all stride variables (Ln, Tn, Sn) and GEM variables (δT, δP), consistent with the notion that imposing greater overall control leads to more rapid reversals of deviations in each of these variables. Thus, changing the stride-to-stride control in the model alters the DFA α exponent results, independent of changes in variability.

Similar articles

Cited by

References

    1. Robinovitch SN, Feldman F, Yang Y, Schonnop R, Leung PM, Sarraf T, et al. Video capture of the circumstances of falls in elderly people residing in long-term care: an observational study. Lancet. 2013;381:47–54. - PMC - PubMed
    1. Kannus P, Sievänen H, Palvanen M, Järvinen T, Parkkari J. Prevention of falls and consequent injuries in elderly people. Lancet. 2005;366:1885–93. - PubMed
    1. Stevens JA, Corso PS, Finkelstein EA, Miller TR. The costs of fatal and non-fatal falls among older adults. Inj Prev. 2006;12:290–5. - PMC - PubMed
    1. Sterling DA, O’Connor JA, Bonadies J. Geriatric falls: Injury severity is high and disproportionate to mechanism. Journal of Trauma. 2001;50:116–9. - PubMed
    1. Stevens JA, Mack KA, Paulozzi LJ, Ballesteros MF. Self-Reported Falls and Fall-Related Injuries Among Persons Aged ≥ 65 Years–United States, 2006. Journal of Safety Research. 2008;39:345–9. - PubMed