. 2017 Apr 28;18(1):78.
doi: 10.1186/s13059-017-1204-4.

Longitudinal genomic surveillance of Plasmodium falciparum malaria parasites reveals complex genomic architecture of emerging artemisinin resistance

Affiliations

Longitudinal genomic surveillance of Plasmodium falciparum malaria parasites reveals complex genomic architecture of emerging artemisinin resistance

Gustavo C Cerqueira et al. Genome Biol. .

Abstract

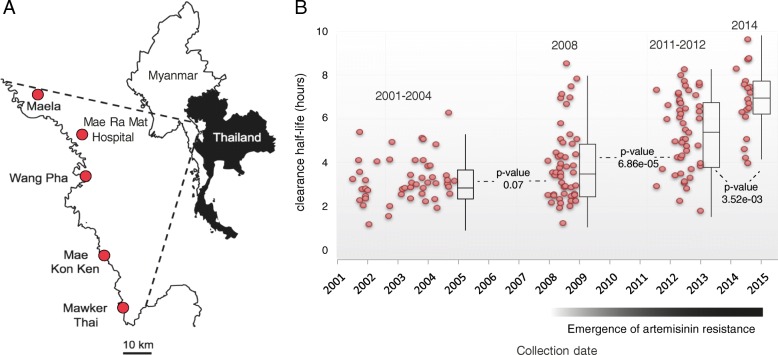
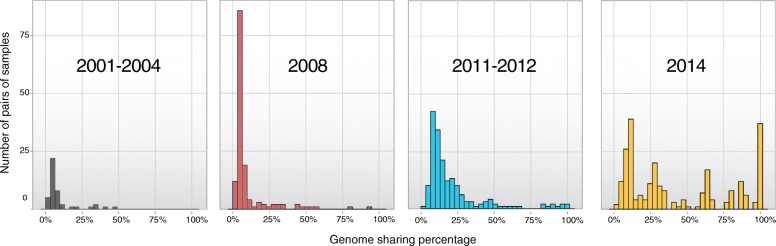
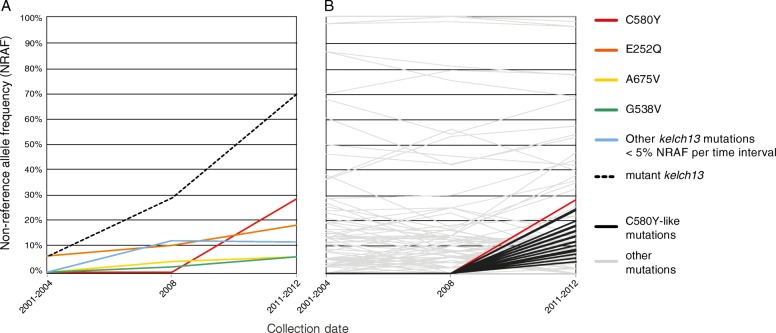
Background: Artemisinin-based combination therapies are the first line of treatment for Plasmodium falciparum infections worldwide, but artemisinin resistance has risen rapidly in Southeast Asia over the past decade. Mutations in the kelch13 gene have been implicated in this resistance. We used longitudinal genomic surveillance to detect signals in kelch13 and other loci that contribute to artemisinin or partner drug resistance. We retrospectively sequenced the genomes of 194 P. falciparum isolates from five sites in Northwest Thailand, over the period of a rapid increase in the emergence of artemisinin resistance (2001-2014).

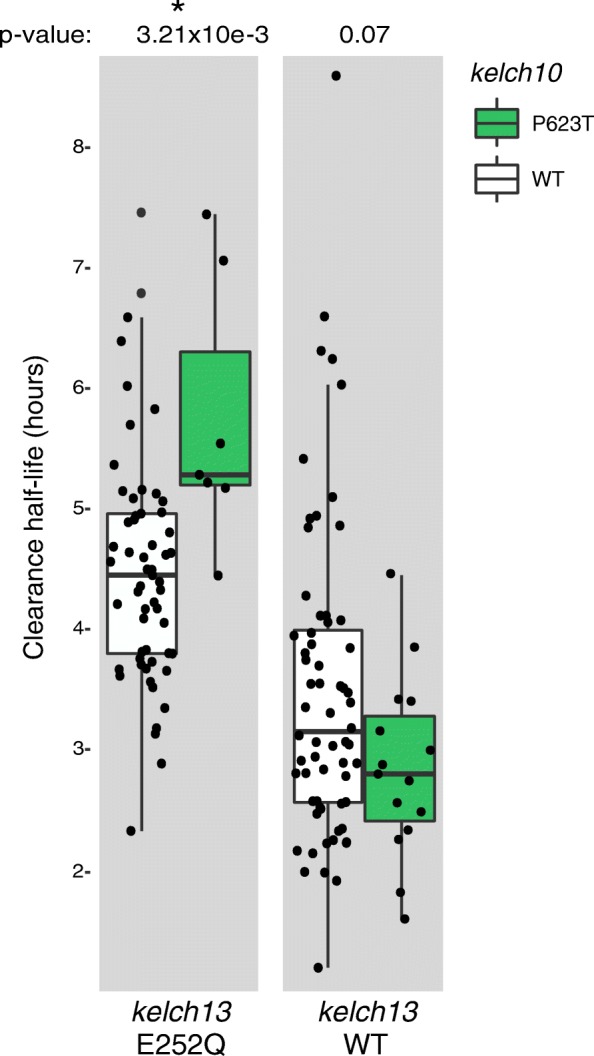
Results: We evaluate statistical metrics for temporal change in the frequency of individual SNPs, assuming that SNPs associated with resistance increase in frequency over this period. After Kelch13-C580Y, the strongest temporal change is seen at a SNP in phosphatidylinositol 4-kinase, which is involved in a pathway recently implicated in artemisinin resistance. Furthermore, other loci exhibit strong temporal signatures which warrant further investigation for involvement in artemisinin resistance evolution. Through genome-wide association analysis we identify a variant in a kelch domain-containing gene on chromosome 10 that may epistatically modulate artemisinin resistance.

Conclusions: This analysis demonstrates the potential of a longitudinal genomic surveillance approach to detect resistance-associated gene loci to improve our mechanistic understanding of how resistance develops. Evidence for additional genomic regions outside of the kelch13 locus associated with artemisinin-resistant parasites may yield new molecular markers for resistance surveillance, which may be useful in efforts to reduce the emergence or spread of artemisinin resistance in African parasite populations.

Keywords: Drug resistance; Epistasis; Genomics; Malaria; Surveillance.


Figures

Fig. 1
Fig. 1
Location, collection date, and parasite clearance rate associated with patient blood samples. a Location of clinics in Northwestern Thailand involved in the collection of samples used in this study. b Distribution of the parasite clearance rate half-life associated with each sample. Red dots indicate collection date (horizontal axis) and clearance rate half-life (vertical axis) of each isolate. Box plots summarize the distribution of clearance rate half-life within each time period. Box boundaries represent the first and third quartiles and the length of whiskers corresponds to 1.5 times the interquartile range. The distributions between adjacent time periods were compared using Wilcoxon rank sum tests
Fig. 2
Fig. 2
Percentage of genome sequence shared between pairs of samples. The vertical axis represents the number of pairwise comparisons exhibiting IBD levels (expressed as a percentage of the full genome) within the range intervals specified on the horizontal axis. Only pairs with a non-zero percentage of genomic sharing are shown
Fig. 3
Fig. 3
Non-reference allele frequency (NRAF) computed for samples belonging to the first three sampling intervals. a NRAF trajectories over time within the kelch13 resistance locus. Colored lines indicate the progression of the allele frequency of non-synonymous substitutions located within kelch13 and having frequency greater than 5% in at least one of the collection eras depicted in this graph (2001–2004, 2008, and 2011–2012) and all other kelch13 mutations not meeting this criterion (blue line). The dashed line represents the percentage of samples with at least one non-synonymous substitution in kelch13. b NRAF trajectories over time outside the kelch13 gene. Gray lines show the frequency of 100 alleles randomly chosen from all SNPs detected in the dataset. The red line represents the frequency of C580Y across the first three collection intervals. Black lines indicate the frequency of what we designate as the “C580Y-like” set: alleles absent in the earliest collection phases (2001–2004, 2008) but with NRAF higher than 5% in 2011–2012
Fig. 4
Fig. 4
Increased clearance half-life on samples harboring kelch13 E252Q and kelch10 P623T mutations. Boxplots on the left illustrate the distribution of clearance half-life on samples with the E252Q kelch13 mutation and either with (green) or without (white) the kelch10 P623T mutation. The boxplot on the right represents the distribution of the same phenotype on samples harboring wild-type (WT) kelch13. Box boundaries represent the first and third quartiles and the length of whiskers corresponds to 1.5 times the interquartile range. The difference between distributions shown in each boxplot was evaluated by a Wilcoxon rank sum test
Fig. 5
Fig. 5
Signatures of selection of C580Y-like SNPs. a Distribution of linkage disequilibrium (r) between mutant kelch13 and other SNPs, binned according to the 2011–2012 NRAF (interval left-closed, right-open). Boxplots in black depict the distribution of C580Y-like SNPs. The boxplots in blue depict the distribution of controls (SNPs with comparable NRAF in 2011–2012 but exhibiting non-zero NRAF in the earlier collection phases). Box boundaries represent the first and third quartiles and the length of whiskers corresponds to 1.5 times the interquartile range. P values indicate significantly different distributions of C580Y-like and control SNPs (Wilcoxon test). b Comparison of the distribution of non-normalized iHS (integrated haplotype score) values for C580Y-like SNPs and control SNPs. Lower iHS values indicate a stronger signature of selection. P values indicate significantly different iHS distributions for C580Y-like versus control SNPs (Wilcoxon test). c Comparison of the kelch13 allelic richness of association between C580Y-like SNPs (black) and control SNPs (blue). Each graph shows the distribution of richness for SNPs with NRAF (2011–2012) within the same quartiles defined for iHS and LD boxplots; quartiles are indicated on the top of each graph. Horizontal axes indicate the number of distinct kelch13 mutations co-occurring with each SNP (richness). Vertical axes indicate the percentage of SNPs. Controls consist of SNPs with 2011–2012 NRAF within the same quartile as candidate SNPs. P values on the top of the graph indicate significantly different distributions between C580Y-like and control SNPs (Wilcoxon test). The C580Y-like SNPs with NRAF less than 8% generally exhibit association with fewer kelch13 alleles than control SNPs, indicating they may be more likely to be products of genetic hitchhiking than C580Y-like SNPs with higher NRAF

Comment in

References

    1. Sinclair D, Zani B, Donegan S, Olliaro P, Garner P. Artemisinin-based combination therapy for treating uncomplicated malaria. Cochrane Database Syst Rev. 2009;(3):CD007483. doi: 10.1002/14651858.CD007483.pub2. - PMC - PubMed
    1. World Health Organization . Guidelines for the treatment of malaria. 3 2015. - PubMed
    1. Noedl H, Se Y, Schaecher K, Smith BL, Socheat D, Fukuda MM. Evidence of artemisinin-resistant malaria in Western Cambodia. N Engl J Med. 2008;359:2619–20. doi: 10.1056/NEJMc0805011. - DOI - PubMed
    1. Dondorp AM, Nosten F, Yi P, Das D, Phyo AP, Tarning J, et al. Artemisinin resistance in Plasmodium falciparum malaria. N Engl J Med. 2009;361:455–67. doi: 10.1056/NEJMoa0808859. - DOI - PMC - PubMed
    1. Ashley EA, Dhorda M, Fairhurst RM, Amaratunga C, Lim P, Suon S, et al. Spread of artemisinin resistance in Plasmodium falciparum malaria. N Engl J Med. 2014;371:411–23. doi: 10.1056/NEJMoa1314981. - DOI - PMC - PubMed

MeSH terms

LinkOut - more resources