. 2017 Apr 28;16(1):85.
doi: 10.1186/s12943-017-0645-4.

The landscape of BRAF transcript and protein variants in human cancer

Affiliations

The landscape of BRAF transcript and protein variants in human cancer

Andrea Marranci et al. Mol Cancer. .

Erratum in

  • Correction: The landscape of BRAF transcript and protein variants in human cancer.
    Marranci A, Jiang Z, Vitiello M, Guzzolino E, Comelli L, Sarti S, Lubrano S, Franchin C, Echevarría-Vargas I, Tuccoli A, Mercatanti A, Evangelista M, Sportoletti P, Cozza G, Luzi E, Capobianco E, Villanueva J, Arrigoni G, Signore G, Rocchiccioli S, Pitto L, Tsinoremas N, Poliseno L. Marranci A, et al. Mol Cancer. 2025 Feb 3;24(1):42. doi: 10.1186/s12943-025-02241-w. Mol Cancer. 2025. PMID: 39901172 Free PMC article. No abstract available.

Abstract

Background: The BRAF protein kinase is widely studied as a cancer driver and therapeutic target. However, the regulation of its expression is not completely understood.

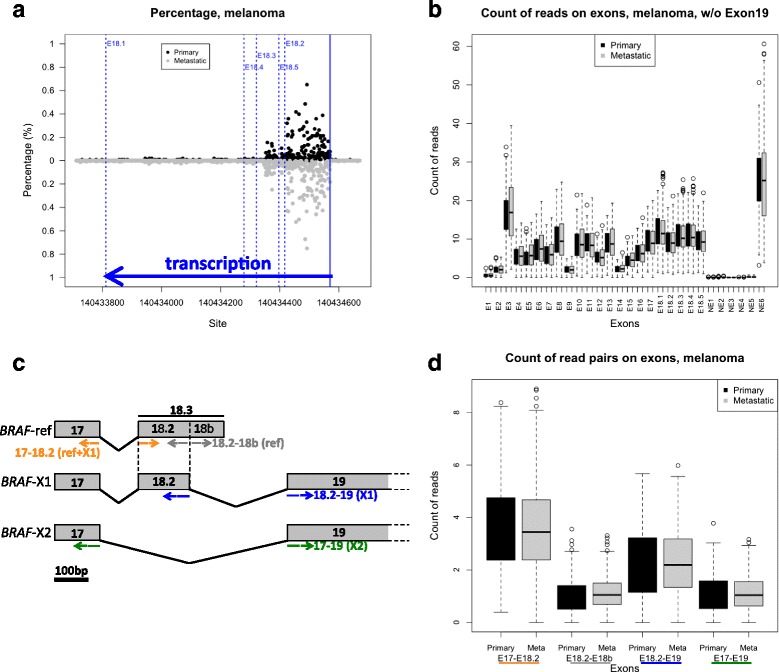
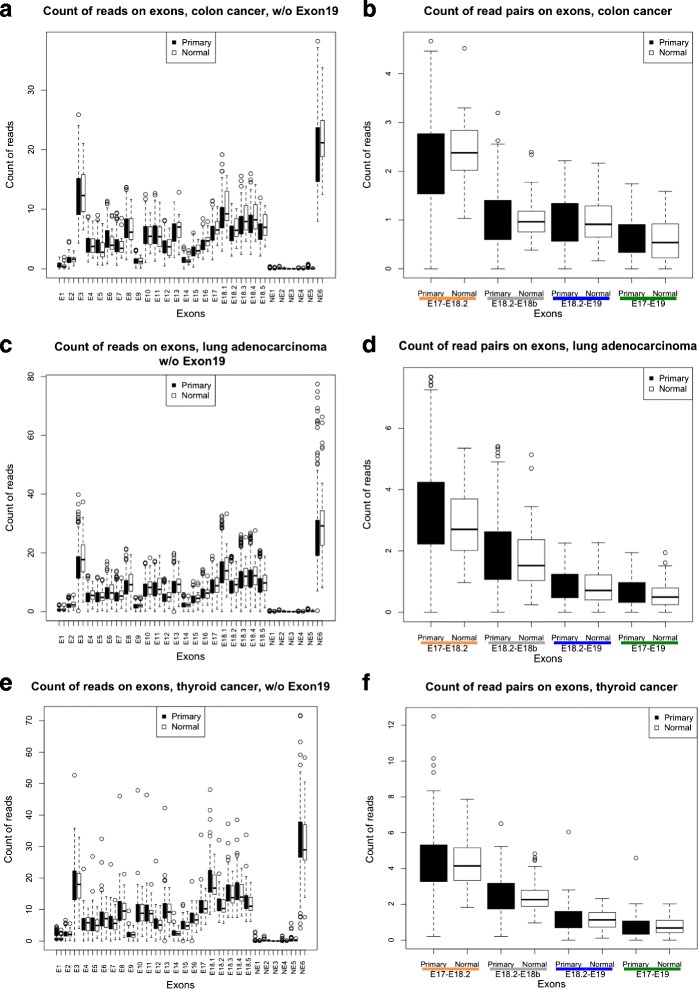
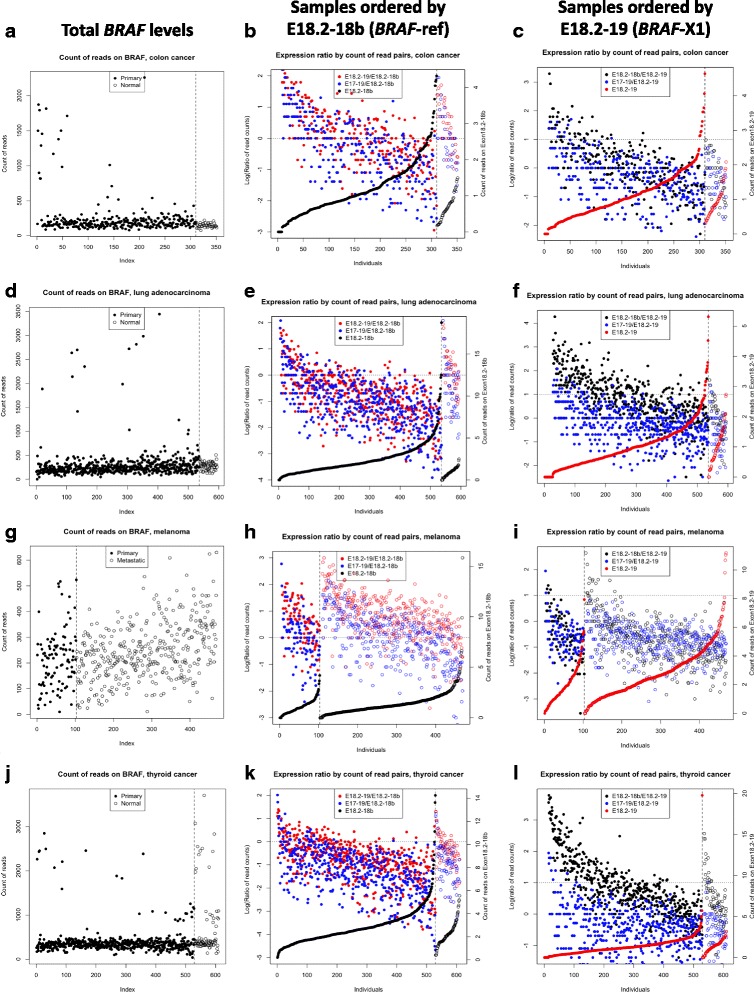
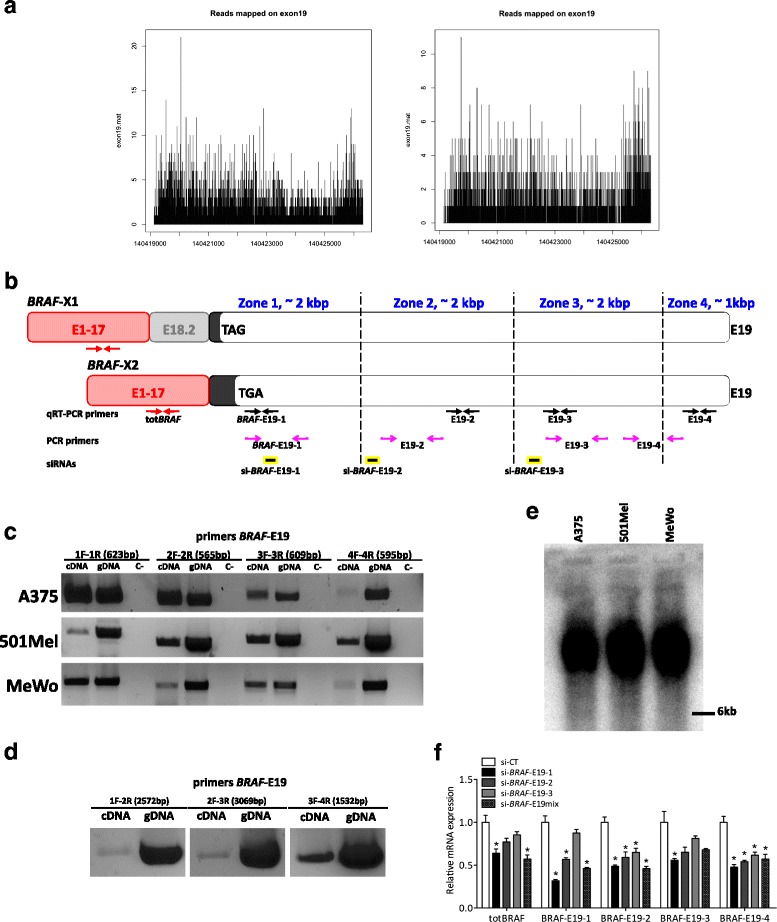
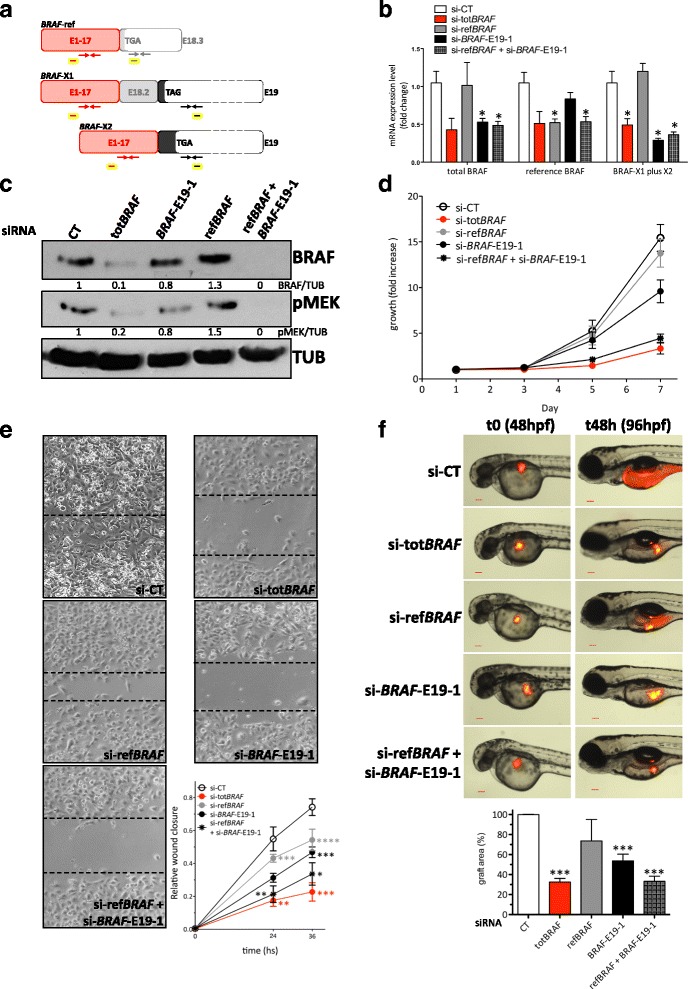
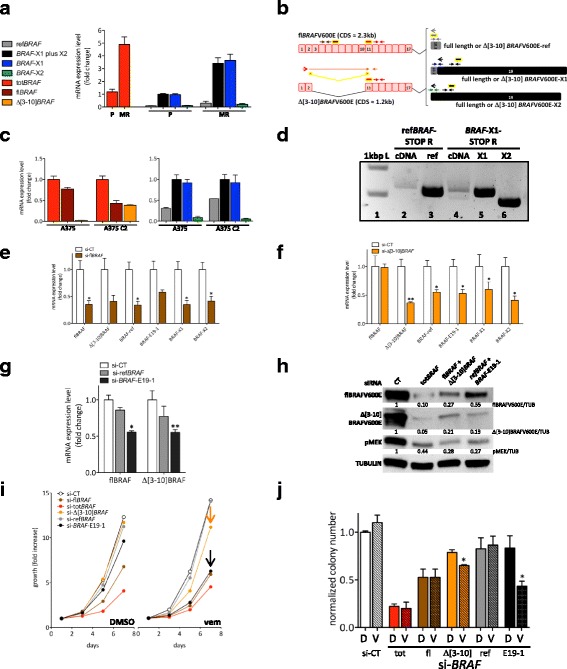
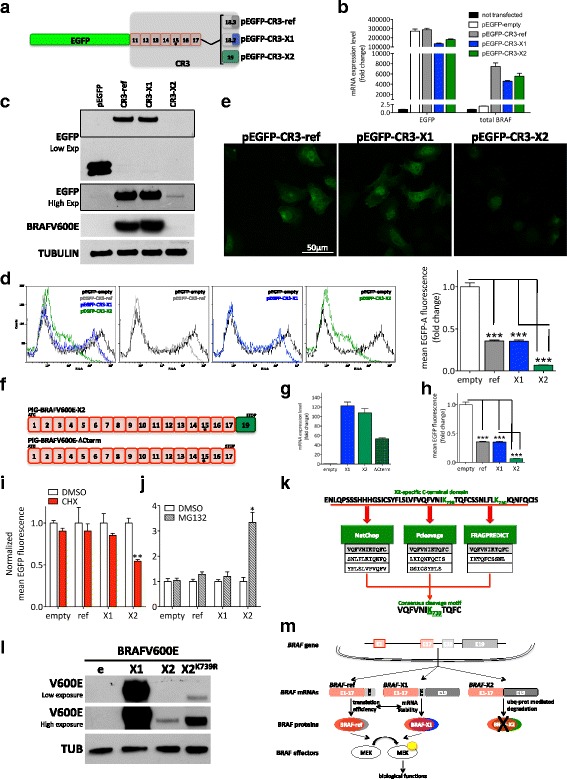
Results: Taking advantage of the RNA-seq data of more than 4800 patients belonging to 9 different cancer types, we show that BRAF mRNA exists as a pool of 3 isoforms (reference BRAF, BRAF-X1, and BRAF-X2) that differ in the last part of their coding sequences, as well as in the length (BRAF-ref: 76 nt; BRAF-X1 and BRAF-X2: up to 7 kb) and in the sequence of their 3'UTRs. The expression levels of BRAF-ref and BRAF-X1/X2 are inversely correlated, while the most prevalent among the three isoforms varies from cancer type to cancer type. In melanoma cells, the X1 isoform is expressed at the highest level in both therapy-naïve cells and cells with acquired resistance to vemurafenib driven by BRAF gene amplification or expression of the Δ[3-10] splicing variant. In addition to the BRAF-ref protein, the BRAF-X1 protein (the full length as well as the Δ[3-10] variant) is also translated. The expression levels of the BRAF-ref and BRAF-X1 proteins are similar, and together they account for BRAF functional activities. In contrast, the endogenous BRAF-X2 protein is hard to detect because the C-terminal domain is selectively recognized by the ubiquitin-proteasome pathway and targeted for degradation.

Conclusions: By shedding light on the repertoire of BRAF mRNA and protein variants, and on the complex regulation of their expression, our work paves the way to a deeper understanding of a crucially important player in human cancer and to a more informed development of new therapeutic strategies.

Keywords: BRAF; Exon-spanning reads; Melanoma; Protein variants; RNA-sequencing; Transcript variants.


Figures

Fig. 1
Fig. 1
Expression of BRAF transcript variants in melanoma. a Analysis of the length of BRAF 3’UTR by counting the reads mapped to E18.1,2,3,4, and 5. b Count of the reads mapped to all BRAF exons, except E19. c Cartoon depicting the strategy used to measure the relative expression levels of BRAF-ref, BRAF-X1, and BRAF-X2. Paired reads spanning: exon 17 and exon 18.2 were counted as a measure of the cumulative levels of BRAF-ref and BRAF-X1 (yellow); exon 18.2 and exon 18b were counted as a measure of BRAF-ref levels (grey); exon 18.2 and exon 19 were counted as a measure of BRAF-X1 levels (blue); and exon 17 and exon 19 were counted as measure of BRAF-X2 (green). d Box plot of the reads that span E17-E18.2, E18.2-E18b, E18.2-E19, and E17-E19 in primary (black boxes) and metastatic (grey boxes) melanoma samples
Fig. 2
Fig. 2
Expression of BRAF exons and transcript variants in colon cancer, lung adenocarcinoma and thyroid cancer. a, c, e Count of the reads mapped to all BRAF exons, except E19. (b, d, f) Box plot of the reads that span E17-E18.2 (BRAF-ref + BRAF-X1, yellow), E18.2-E18b (BRAF-ref, grey), E18.2-E19 (BRAF-X1, blue), and E17-E19 (BRAF-X2, green) in primary (black boxes) and normal (white boxes) samples
Fig. 3
Fig. 3
Correlation among the expression levels of the different BRAF isoforms in colon cancer, lung adenocarcinoma, melanoma and thyroid cancer. a, d, g, j Total number of BRAF reads across patients. b, e, h, k Expression ratios over the ref spanning reads. Samples were sorted by reads spanning E18.2-E18.b (BRAF-ref, in black). Red dots are E18.2-E19/E18.2-E18b ratios (which means the X1/ref ratio) and blue dots are E17-E19/E18.2-E18b ratios (which means the X2/ref ratio). The data points are log transformed and the dotted line marks the 0, which means X1/ref ratio = 1 and X2/ref ratio = 1. c, f, i, l Expression ratios over the X1 spanning reads. Samples were sorted by reads spanning E18.2-E19 (BRAF-X1, in red). Black dots are E18.2-E18b/E18.2-E19 ratios (which means the ref/X1 ratio) and blue dots are E17-E19/E18.2-E19 ratios (which means the X2/X1 ratio). The data points are log transformed and the dotted line marks the 0, which means ref/X1 ratio = 1 and X2/X1 ratio = 1. In the left and middle panels the samples are presented in the same order
Fig. 4
Fig. 4
Length of BRAF-X1 and BRAF-X2 3’UTR in melanoma. a The analysis of the reads mapping to exon 19 across its entire length indicates that the 3’UTR of BRAF-X1 and BRAF-X2 is as long as 7 kb. A representative example of a primary (left) and a metastatic (right) melanoma case is reported. b Cartoon summarizing the position of the primers and the siRNAs used to determine the length of the 3’UTR of BRAF-X1 and BRAF-X2 in melanoma cell lines. The 4 primer pairs used for real-time PCR amplification of BRAF-X1 plus X2 (BRAF-E19-1/2/3/4 qRT-PCR F/R) are represented as black arrows. The 4 primer pairs used for PCR amplification of BRAF-X1 plus X2 (BRAF-E19-1/2/3/4 F/R) are represented as open pink arrows. BRAF-E19-1 qRT-PCR F and BRAF-E19-1 F have the same sequence. The siRNAs used to knock-down BRAF-X1 plus X2 (si-BRAF-E19-1/2/3) are represented as yellow and black rectangles. The primers used for real-time PCR amplification of all BRAF isoforms (totBRAF qRT-PCR F/R) are represented as red arrows. c PCR performed on A375, 501Mel and MeWo melanoma cells using BRAF-E19-1/2/3/4 primer pairs. Genomic DNA (gDNA) is used as positive control. d Chained PCR performed on A375 melanoma cells using “hybrid” primer pairs: BRAF-E19-1 F with BRAF-E19-2 R, BRAF-E19-2 F with BRAF-E19-3 R, and BRAF-E19-3 F with BRAF-E19-4 R. Genomic DNA (gDNA) is used as positive control. e Northern blot of total RNA extracted from A375, 501Mel, and MeWo cells and hybridized with a labeled probe for BRAF CDS. Considering that the size of BRAF CDS is about 2.3 kb, the band detected in all cell lines is consistent with a 7 kb long 3’UTR. f Expression levels of BRAF CDS (detected using the totBRAF qRT-PCR primers) and of different regions of the 3’UTR transcribed from E19 (detected using the BRAF-E19-1/2/3/4 qRT-PCR primer pairs) after the transfection of the indicated siRNAs. The pictures are taken from 1 out of 3 independent experiments performed, all with comparable outcome. The graphs represent the mean ± SEM of 3 independent experiments. *p < 0.05
Fig. 5
Fig. 5
BRAF isoforms together account for BRAF functions in melanoma cells. a Cartoon summarizing the position of the primers and the siRNAs used to determine the contribution of reference, X1 and X2 isoforms to BRAF activities in melanoma cell lines. The primers used for real-time PCR amplification of all BRAF isoforms (totBRAF qRT-PCR F/R), BRAF-ref (refBRAF qRT-PCR F/R), and BRAF-X1 plus X2 (BRAF-E19-1 qRT-PCR F/R) are represented as red, grey and black arrows, respectively. The siRNAs used for the knock-down of the different BRAF isoforms are schematically represented as rectangles: yellow and red, for the knock-down of all BRAF isoforms (si-totBRAF); yellow and grey, for the knock-down of BRAF-ref (si-refBRAF); and yellow and black for the knock-down of BRAF-X1 plus X2 (si-BRAF-E19-1). b Real-time PCR detection of total BRAF, BRAF-ref, and BRAF-X1 plus X2 24 h after the transfection of the indicated siRNAs in A375 cells. c Western blot of BRAF and of its substrate pMEK 48 h after the transfection of the indicated siRNAs in A375 cells. d Growth curve of A375 cells after the transfection of the indicated siRNAs. e Wound healing assay performed using A375 cells transfected with the ndicated siRNAs. The pictures were taken 24 and 36 h after the removal of the silicone inserts. f Xenograft in zebrafish embryos of A375 cells stably expressing mCherry and transfected with the indicated siRNAs. The pictures are taken from 1 out of 3 independent experiments performed, all with comparable outcome. Hpf: hours post fertilization. Scale bar: 100 um. The graphs represent the mean ± SEM of 3 independent experiments. *p < 0.05; **p < 0.01; ***p < 0.001; ****p < 0.0001
Fig. 6
Fig. 6
BRAF transcript variants in the context of acquired resistance to BRAF and MEK inhibitors. a Real-time PCR detection of total BRAF (red), BRAF-ref (grey), BRAF-X1 plus X2 (black), BRAF-X1 (blue), and BRAF-X2 (green) in 451Lu parental cells (P) and in 451Lu-MR resistant cells (MR). The latter show acquired resistance to BRAF and MEK inhibitors due to the focal amplification of the BRAF gene. b Cartoon summarizing the position of the primers and the siRNAs used to determine the presence and the level of the Δ[3–10] variant of BRAF. For details, please refer to Additional file 1: Figure S17. c Real-time PCR detection of total BRAF (red), full length BRAF (brown), Δ[3–10]BRAF (orange, left panel), BRAF-ref (grey), BRAF-X1 plus X2 (black), BRAF-X1 (blue), and BRAF-X2 (green, right panel) in A375 parental cells and in A375 C2 cells. The latter show acquired resistance to vemurafenib due to the presence of Δ[3–10]BRAFV600E splicing variant. d PCR amplification of the reference, X1, and X2 Δ[3–10]BRAF splicing variants from the cDNA of A375 C2 cells. Lane 1: 1 kbp ladder. Lane 2: Δ[3–10]BRAF-ref amplification was obtained using BRAF-E1/2 F primer and refBRAF-STOP R primer (open red and grey arrows in b). Lane 3: Δ[3–10]BRAF-ref CDS was amplified from pMSCVHygro-Δ[3–10]BRAFV600E-ref plasmid and used as positive control. Lane 4: the amplification of Δ[3–10]BRAF-X1 (upper band) and Δ[3–10]BRAF-X2 (lower band) was obtained using BRAF-E1/2 F primer and BRAF-X1-STOP R primer (open red and black arrows in b). Lane 5: Δ[3–10]BRAF-X1 CDS was amplified from pMSCVHygro-Δ[3–10]BRAFV600E-X1 plasmid and used as positive control. Lane 6: Δ[3–10]BRAF-X2 CDS was amplified from pMSCVHygro-Δ[3–10]BRAFV600E-X2 plasmid and used as positive control. e-f Real-time PCR detection of full length BRAF, Δ[3–10]BRAF, BRAF-ref, BRAF-X1 plus X2, BRAF-X1, and BRAF-X2 24 h after the transfection of si-flBRAF (e) and si-Δ[3–10]BRAF (f) in A375 C2 cells. g Real-time PCR detection of full length and Δ[3–10] BRAF 24 h after the transfection of si-refBRAF and si-BRAF-E19-1 in A375 C2 cells. h Western blot of full length and Δ[3–10] BRAFV600E, as well as of pMEK 48 h after the transfection of the indicated siRNAs or siRNA mixes in A375 C2 cells. i Growth curve of A375 C2 cells after the transfection of the indicated siRNAs. Throughout the experiment, the cells were kept in DMSO (left panel) or in 2 uM vemurafenib (right panel). The arrows highlight the increased sensitivity displayed by A375 C2 cells to si-Δ[3–10]BRAF (orange) and si-BRAF-E19-1 (black), when grown in vemurafenib. The graph represents the mean only of 3 independent experiments. (j) Colony formation assay of A375 C2 cells after the transfection of the indicated siRNAs. Throughout the experiment, the cells were kept in DMSO (clean bars) or in 2 uM vemurafenib (dashed bars). The pictures are taken from 1 out of 3 independent experiments performed, all with comparable outcome. The graphs represent the mean ± SEM (or mean ± SD in a and c) of 3 independent experiments. *p < 0.05, **p < 0.01
Fig. 7
Fig. 7
Identification and characterization of BRAF protein isoforms. a Schematic representation of the 3’ terminal region of reference, X1, and X2 BRAF mRNAs, as well as of the corresponding C-terminal regions of reference, X1, and X2 BRAF proteins. b Immunoprecipitation of BRAF protein in A375 cells. Endogenous BRAF was immunoprecipitated using a specific antibody that recognizes the N-terminal domain (IP-BRAF). As negative control, no antibody was used (No Ab). The basal level of BRAF in the cell lysate is shown in Input. c Identification by mass spectrometry of the C-terminal peptides of BRAF-ref and BRAF-X1. Immunoprecipitated BRAF was subjected to LC-MS analysis. The presence of both isoforms is revealed by the detection of isoform-specific peptides (in green). d Best transitions (BRAF-ref: 352 and 904; BRAF-X1: 1046 and 1117) of the two BRAF protein isoforms by mass spectrometry (MRM based method). e-f Upon the transient transfection of PIG-BRAFV600E-ref, X1, and X2 plasmids in HEK293T cells, western blot indicates that only reference and X1 BRAFV600E are efficiently translated and able to phosphorylate MEK, while X2 is not (e). This occurs in spite of the fact that according to real-time PCR for total BRAF levels, all 3 mRNAs are transcribed at similar levels (f). g-i Upon the stable infection of pMSCVHygro-Δ[3–10]BRAFV600E-ref, X1, and X2 plasmids in A375 cells, real-time PCR for total BRAF indicates that all 3 mRNAs are transcribed at similar levels (g), but western blot indicates that reference and X1 Δ[3–10]BRAFV600E are efficiently translated and able to phosphorylate MEK even in the presence of vemurafenib, while X2 is not (h). Consistently, only Δ[3–10]BRAFV600E-ref and -X1 are able to decrease the sensitivity of A375 cells to vemurafenib (i). The pictures are taken from 1 out of 3 independent experiments performed, all with comparable outcome. The graphs represent the mean ± SEM of 3 independent experiments
Fig. 8
Fig. 8
The X2 isoform displays a faster decay due to increased proteosomal-mediated degradation. a Schematic representation of the chimerical protein derived from the fusion of EGFP coding sequence with the CR3 domain of BRAFV600E-ref, X1, and X2 within the pEGFP-C1 plasmid. The asterisk indicates the presence of the V600E mutation. b-e Upon the transient transfection of pEGFP-C1 empty (pEGFP-empty), pEGFP-CR3-ref, pEGFP-CR3-X1, and pEGFP-CR3-X2 plasmids in A375 cells, real-time PCR performed with primers for EGFP and for total BRAF indicates that the chimerical mRNAs are all transcribed at similar levels (b), but western blot (c), flow cytometry (d) and confocal microscopy analysis (e) indicate that, when fused with CR3-X2, EGFP protein is expressed at lower levels. The dotted box shows a higher exposure of the anti-EGFP antibody. f-h When PIG-BRAFV600E-ΔCterm plasmid, which lacks the nucleotides encoding for the X2-specific C-terminal domain (f), is transiently transfected in HEK293T cells, not only BRAF mRNA (g), but also BRAF protein is detectable (h). e: empty PIG-NotI; X1: PIG-BRAFV600E-X1 (used as positive control); X2: PIG-BRAFV600E-X2; ΔCterm: PIG-BRAFV600E-ΔCterm. i-j Upon the transient transfection of pEGFP-empty, pEGFP-CR3-ref, pEGFP-CR3-X1, and pEGFP-CR3-X2 plasmids, A375 cells were treated with 100 ug/ml cicloheximide (CHX) (i) or 20 uM MG132 (j) for 8 h. The CHX treatment indicates that the decay rate of CR3-X2 is faster than that of CR3-ref and CR3-X1, while the MG132 treatment suggests that this is due to higher degradation rate through the ubiquitin-proteasome pathway. k The prediction of potential proteasomal cleavage sites using 3 different algorithms retrieves the indicated X2-specific consensus peptide. (l) The mutagenesis of Lys739 into a proteasome-insensitive Arg rescues the expression of the X2 isoform of BRAF protein. e: empty PIG-NotI; X1: PIG-BRAFV600E-X1 (used as positive control); X2: PIG-BRAFV600E-X2; X2K739R: PIG-BRAFV600E-X2 in which Lys(K)739 has been substituted with Arg(R) (AAA to AGA triplet change). m Cartoon that summarizes the main findings of this article (details in the text). The pictures are taken from 1 out of 3 independent experiments performed, all with comparable outcome. The graphs represent the mean ± SEM of 3 independent experiments. *p < 0.05, **p < 0.01, ***p < 0.001

References

    1. Lavoie H, Therrien M. Regulation of RAF protein kinases in ERK signalling. Nat Rev Mol Cell Biol. 2015;16:281–98. doi: 10.1038/nrm3979. - DOI - PubMed
    1. Flockhart RJ, Webster DE, Qu K, Mascarenhas N, Kovalski J, Kretz M, Khavari PA. BRAFV600E remodels the melanocyte transcriptome and induces BANCR to regulate melanoma cell migration. Genome Res. 2012;22:1006–14. doi: 10.1101/gr.140061.112. - DOI - PMC - PubMed
    1. Jiang CC, Croft A, Tseng HY, Guo ST, Jin L, Hersey P, Zhang XD. Repression of microRNA-768-3p by MEK/ERK signalling contributes to enhanced mRNA translation in human melanoma. Oncogene. 2014;33:2577–88. doi: 10.1038/onc.2013.237. - DOI - PubMed
    1. Forloni M, Dogra SK, Dong Y, Conte D, Jr, Ou J, Zhu LJ, Deng A, Mahalingam M, Green MR, Wajapeyee N. miR-146a promotes the initiation and progression of melanoma by activating Notch signaling. Elife. 2014;3:e01460. doi: 10.7554/eLife.01460. - DOI - PMC - PubMed
    1. Vitiello M, Tuccoli A, D’Aurizio R, Sarti S, Giannecchini L, Lubrano S, Marranci A, Evangelista M, Peppicelli S, Ippolito C, Barravecchia I, Guzzolino E, Montagnani V, Gowen M, Mercoledi E, Mercatanti A, Comelli L, Gurrieri S, Wu LW, Ope O, Flaherty K, Boland GM, Hammond MR, Kwong L, Chiariello M, Stecca B, Zhang G, Salvetti A, Angeloni D, Pitto L, Calorini L, Chiorino G, Pellegrini M, Herlyn M, Osman I and Poliseno L. Context-dependent miR-204 and miR-211 affect the biological properties of amelanotic and melanotic melanoma cells. Oncotarget. 2017. doi: 10.18632/oncotarget.15915. - PMC - PubMed

MeSH terms

LinkOut - more resources