. 2017 Aug 1:400:37-46.
doi: 10.1016/j.canlet.2017.04.029. Epub 2017 Apr 26.

GOT1-mediated anaplerotic glutamine metabolism regulates chronic acidosis stress in pancreatic cancer cells

Affiliations

GOT1-mediated anaplerotic glutamine metabolism regulates chronic acidosis stress in pancreatic cancer cells

Jaime Abrego et al. Cancer Lett. .

Abstract

The increased rate of glycolysis and reduced oxidative metabolism are the principal biochemical phenotypes observed in pancreatic ductal adenocarcinoma (PDAC) that lead to the development of an acidic tumor microenvironment. The pH of most epithelial cell-derived tumors is reported to be lower than that of plasma. However, little is known regarding the physiology and metabolism of cancer cells enduring chronic acidosis. Here, we cultured PDAC cells in chronic acidosis (pH 6.9-7.0) and observed that cells cultured in low pH had reduced clonogenic capacity. However, our physiological and metabolomics analysis showed that cells in low pH deviate from glycolytic metabolism and rely more on oxidative metabolism. The increased expression of the transaminase enzyme GOT1 fuels oxidative metabolism of cells cultured in low pH by enhancing the non-canonical glutamine metabolic pathway. Survival in low pH is reduced upon depletion of GOT1 due to increased intracellular ROS levels. Thus, GOT1 plays an important role in energy metabolism and ROS balance in chronic acidosis stress. Our studies suggest that targeting anaplerotic glutamine metabolism may serve as an important therapeutic target in PDAC.

Keywords: Acidic microenvironment; Anaplerotic glutamine metabolism; Cancer metabolism; Low pH; Pancreatic cancer.


Conflict of interest statement

Competing Interests: The authors have declared that no competing interests exist.

Figures

Figure 1
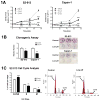
Figure 1. Chronic acidosis reduces proliferation of PDAC cells
(A) Survival of S2-013 and Capan-1 PDAC cells cultured under conditions of varying pH of culture media by MTT assays. (B) 14-day Colony formation assays for cells cultured in control pH (7.4) and low pH (7.0). (C) Cell cycle analysis of S2-013 cells in control and low pH. The bar chart on the left represents percent distribution of cells in different phases of cell cycle. Data in figures 1A and 1B was normalized to that of the control pH 7.4 (physiological pH value). Error bars represent mean ± S.E.M. from at least three different samples. Two-way ANOVA with Bonferroni post-test analysis was used for figure 1A to compare growth in low pH versus physiological pH. A two-tailed Student’s t-test was used to compare low pH and control pH (B and C) with p-values * p<0.05, ** p<0.01, and *** p<0.001.
Figure 2
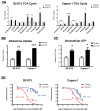
Figure 2. PDAC cells under chronic acidosis demonstrate reduced aerobic glycolysis
(A) 3H-glucose uptake and (B) lactate release in S2-013 and Capan-1 cells at control (7.4) and low pH (7.0). (C) LC-MS/MS-based metabolomics analysis of glycolysis metabolites from cells cultured at control and low pH. Data is normalized to that of the cells at control pH (7.4). Error bars represent mean ± S.E.M. from at least three different replicates. A two-tailed Student’s t-test (A–C) was conducted to compare metabolites in cells at low pH relative to control pH with p-values * p<0.05, **p<0.01, *** p<0.001.
Figure 3
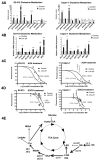
Figure 3. Oxidative metabolism is enhanced in low pH culture conditions
(A) LC-MS/MS-based metabolomics analysis of TCA cycle metabolites in control (7.4) and low pH (7.0) culture conditions. (B) 3H-glutamine uptake of S2-013 and Capan-1 in control and low pH conditions. (C) Intracellular ATP levels of S2-013 and Capan-1 in control and low pH conditions. (D) Sensitivity of S2-013 and Capan-1 cells to oligomycin in control and low pH. Data in bar charts is normalized to the values for the control pH (7.4). Error bars represent mean ± S.E.M. from at least three different samples. A two-tailed Student’s t-test was conducted on Figure 3A–3C with p-values * p<0.05, **p<0.01, *** p<0.001.
Figure 4
Figure 4. Non-canonical anaplerotic glutamine metabolism is enhanced in chronic acidosis
(A) LC-MS/MS-based metabolomic analysis of non-canonical glutamine metabolism in control (7.4) and low pH (7.0) culture conditions. (B) Quantitative real-time PCR analysis of genes coding for enzymes involved in non-canonical glutamine metabolism in cells cultured under control and low pH. (C–D) Sensitivity of S2-013 and Capan-1 cells to treatment with aminooxyacetic acid (AOA; C) and to epicogallocatechin gallate (EGCG; D) in control and low pH conditions. (E) A schematic illustration of potential metabolite flow under low pH. Bold arrows indicate glutamine metabolism in low pH through the non-canonical pathway. Data in bar charts is normalized to the values for the control pH (7.4). Error bars represent mean ± S.E.M. from at least three different replicates. A two-tailed Student’s t-test was conducted to compare control versus low pH in Figure 4A and 4B with p-values * p<0.05, **p<0.01, ***p<0.001.
Figure 5
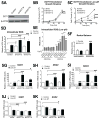
Figure 5. GOT1 regulates cellular ROS levels in chronic acidosis
(A) Western blotting to confirm the knockdown levels of GOT1 in S2-013 with two independent targets by utilizing lentiviral delivery. Cell growth of GOT1 knockdown and scrambled-control (shScr) cells in control pH (B) and low pH (C). (D) Measurement of intracellular ROS using carboxy-H2DCFDA in control and low pH. (E) Measurement of intracellular ROS by staining with carboxy-H2DCFDA (DCFDA), using ROS-insensitive carboxy-DCFDA (CDCF) dye as a control. (F) LC-MS/MS measurement of NADP/NADPH and GSSG/GSH ratio in control and low pH. (G–K) Quantitative real-time PCR analysis of genes coding for enzymes involved in ROS regulation. Data in bar charts is normalized to the values for the control pH (7.4). Two-tailed Student’s t-test was used on Figure 5F to compare control versus low pH. A two-way ANOVA analysis, followed by Bonferroni posttests, was conducted to compare different treatments represented on all the other panels with p-values * p<0.05, **p<0.01, ***p<0.001.
Figure 6
Figure 6. Non-canonical glutamine metabolism regulates ROS levels in chronic acidosis
Growth kinetics of scrambled control (A), and GOT1 knockdown cells (B–C) cultured in low pH supplemented with N-acetyl cysteine (NAC), non-essential amino acids (NEAA), and oxaloacetate (OAA). (B) Colony formation of control and GOT1 knockdown cells supplemented with NAC and OAA. (C) Intracellular ROS levels in control and GOT1 knockdown cells supplemented with OAA and NAC, using H2O2 as a positive control. Data in bar charts is normalized to the values for untreated scrambled control. Data normalized to control pH 7.4 (physiological pH value). Error bars represent mean ± S.E.M. from at least three different replicates. A two-way ANOVA analysis, followed by Bonferroni post-tests, was conducted to compare different treatments with p-value * p<0.05, **p<0.01, ***p<0.001.

References

    1. Hanahan D, Weinberg RA. Hallmarks of cancer: the next generation. Cell. 2011;144:646–674. - PubMed
    1. Cairns RA, Harris IS, Mak TW. Regulation of cancer cell metabolism. Nature reviews Cancer. 2011;11:85–95. - PubMed
    1. Vander Heiden MG, Cantley LC, Thompson CB. Understanding the Warburg effect: the metabolic requirements of cell proliferation. Science. 2009;324:1029–1033. - PMC - PubMed
    1. Newsholme EA, Crabtree B, Ardawi MS. The role of high rates of glycolysis and glutamine utilization in rapidly dividing cells. Bioscience reports. 1985;5:393–400. - PubMed
    1. Warburg O. On respiratory impairment in cancer cells. Science. 1956;124:269–270. - PubMed

Publication types

MeSH terms