

Administration of RANKL boosts thymic regeneration upon bone marrow transplantation
- PMID: 28455312
- PMCID: PMC5452038
- DOI: 10.15252/emmm.201607176
Administration of RANKL boosts thymic regeneration upon bone marrow transplantation
Abstract
Cytoablative treatments lead to severe damages on thymic epithelial cells (TECs), which result in delayed de novo thymopoiesis and a prolonged period of T-cell immunodeficiency. Understanding the mechanisms that govern thymic regeneration is of paramount interest for the recovery of a functional immune system notably after bone marrow transplantation (BMT). Here, we show that RANK ligand (RANKL) is upregulated in CD4+ thymocytes and lymphoid tissue inducer (LTi) cells during the early phase of thymic regeneration. Importantly, whereas RANKL neutralization alters TEC recovery after irradiation, ex vivo RANKL administration during BMT boosts the regeneration of TEC subsets including thymic epithelial progenitor-enriched cells, thymus homing of lymphoid progenitors, and de novo thymopoiesis. RANKL increases specifically in LTi cells, lymphotoxin α, which is critical for thymic regeneration. RANKL treatment, dependent on lymphotoxin α, is beneficial upon BMT in young and aged individuals. This study thus indicates that RANKL may be clinically useful to improve T-cell function recovery after BMT by controlling multiple facets of thymic regeneration.
Keywords: T‐cell reconstitution; bone marrow transplantation; lymphotoxin α; receptor activator of nuclear factor kappa B ligand; thymic regeneration.
© 2017 The Authors. Published under the terms of the CC BY 4.0 license.
Figures
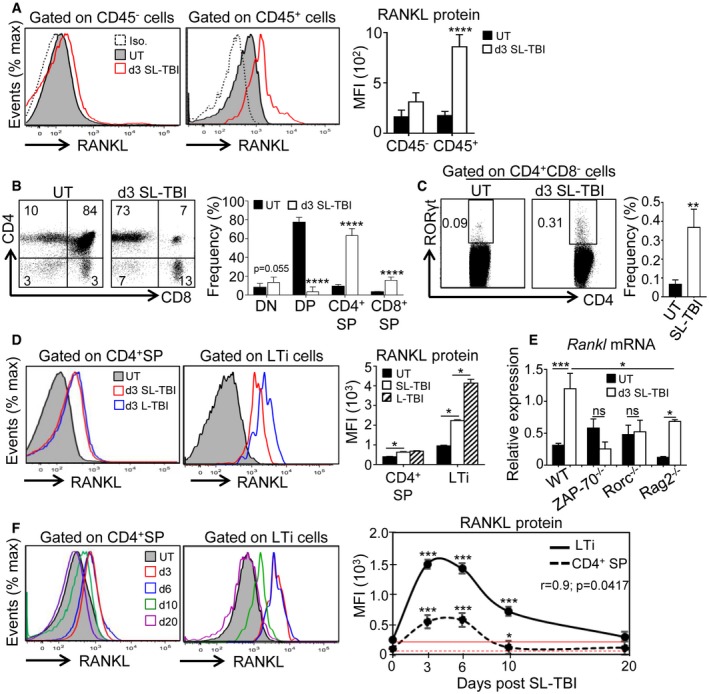
- A
Expression of RANKL protein analyzed by flow cytometry in CD45− and CD45+ thymic cells from untreated (UT) WT mice or at d3 SL‐TBI.
- B, C
Flow cytometry profiles and frequencies of DN (double negative), DP (double positive), CD4+ and CD8+ SP (single positive) (B), and LTi cells (C) from untreated (UT) WT mice or at d3 SL‐TBI.
- D
Expression level of RANKL protein in CD4+ SP and LTi cells from UT WT mice or at d3 SL‐TBI and L‐TBI.
- E
Expression of Rankl mRNA in the total thymus isolated from UT WT, Rorc−/−, ZAP‐70−/−, and Rag2−/− mice or at d3 SL‐TBI (n = 3–6 mice per genotype).
- F
CD4+ SP and LTi cells from UT WT mice or at d3, d6, d10, and d20 SL‐TBI with no hematopoietic rescue were analyzed for the expression of RANKL protein. Mean fluorescence intensity (MFI) of RANKL in CD4+ SP and LTi cells over time following SL‐TBI. The red lines represent the MFI of RANKL at baseline.
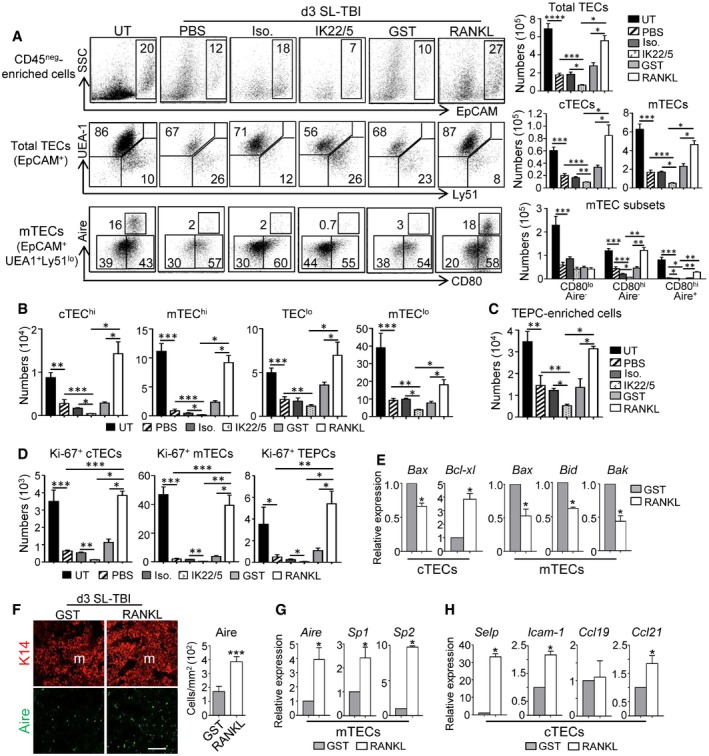
- A
Flow cytometry profiles and numbers of total TECs (EpCAM+), cTECs (UEA‐1−Ly51+), mTECs (UEA‐1+Ly51−), and mTEC subsets (CD80loAire−, CD80hiAire−, and CD80hiAire+) analyzed in CD45neg‐enriched cells by AutoMACS from UT WT mice or treated with PBS, a RANKL isotype control antibody (Iso.), a neutralizing anti‐RANKL antibody (IK22/5), GST or RANKL proteins during 3 days upon SL‐TBI.
- B–D
Histograms show numbers of cTEChi (MHCIIhiUEA‐1−), mTEChi (MHCIIhiUEA‐1+), TEClo (MHCIIloUEA‐1−), mTEClo (MHCIIloUEA‐1+) (B); TEPC‐enriched cells (defined as α6‐integrinhiSca‐1hi in the TEClo subset) (C); and proliferating Ki‐67+ cTECs, mTECs, and TEPC‐enriched cells (D).
- E
Expression of mRNAs coding for pro‐ (Bax, Bid, Bak) and anti‐apoptotic (Bcl‐xl) proteins analyzed by qPCR in purified cTECs and mTECs.
- F
Thymic sections from WT mice treated with GST or RANKL during 3 days upon SL‐TBI were stained for the expression of K14 and Aire. The histogram shows the density of Aire+ cells in medullary area. m denotes the medulla. Fifteen sections were quantified for each condition; scale bar: 100 μm.
- G, H
The expression of Aire and TRAs (Sp1 and Sp2) in purified mTECs (G) and Selp, Icam‐1, Ccl19, and Ccl21 in purified cTECs (H) from WT mice treated with GST or RANKL was analyzed by qPCR.
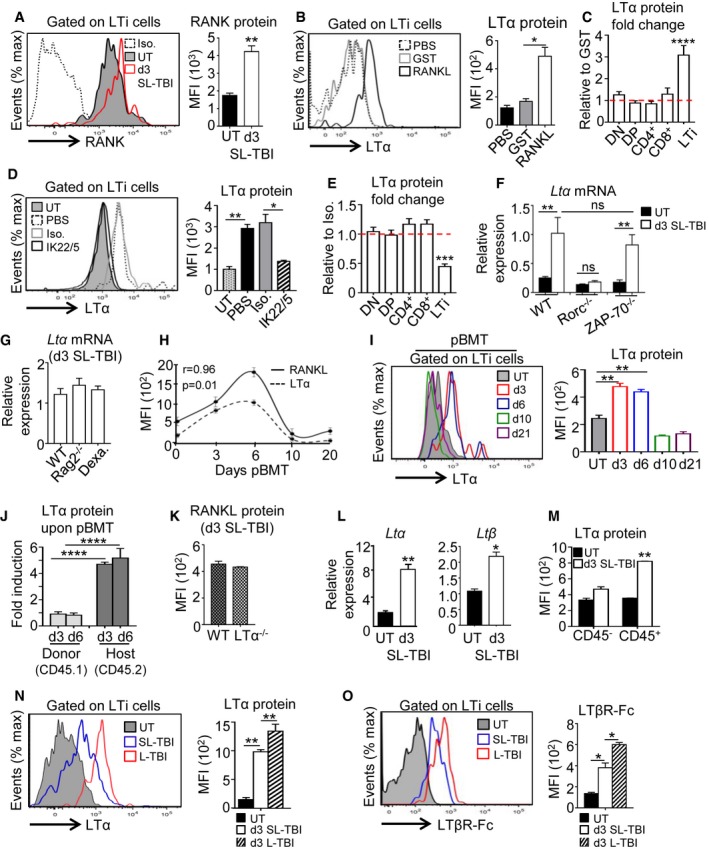
- A
Expression of RANK receptor in thymic LTi cells from UT WT (n = 6) mice and at d3 SL‐TBI (n = 6).
- B
Expression level of LTα protein in thymic LTi cells from WT mice treated in vivo with PBS (n = 6), GST (n = 6), or RANKL‐GST (n = 6) during 3 days after SL‐TBI.
- C
LTα protein was analyzed in thymocyte subsets and LTi cells from WT mice treated in vivo with GST (n = 9) or RANKL‐GST (n = 9) during 3 days after SL‐TBI. Results are represented as fold change relative to the GST condition. Data are pooled of three experiments.
- D
Expression level of LTα protein in thymic LTi cells from WT mice treated in vivo with PBS (n = 6), an isotype control (Iso.) (n = 3), or a neutralizing anti‐RANKL antibody (IL22/5) (n = 6) during 3 days after SL‐TBI.
- E
LTα protein was analyzed in thymocyte subsets and LTi cells from WT mice treated in vivo with an isotype control (n = 3), or a neutralizing anti‐RANKL antibody (n = 6) during 3 days after SL‐TBI. Results are represented as fold change relative to the isotype condition.
- F
Expression of Ltα mRNA in the total thymus isolated from UT WT, Rorc−/−, and ZAP‐70−/− mice or at d3 SL‐TBI (n = 3–6 mice per genotype).
- G
Expression of Ltα mRNA in the total thymus isolated from irradiated: WT, Rag2−/− mice, and WT mice treated 3 days before with dexamethasone (Dexa). Data are pooled of two to three experiments (n = 6–12 mice per group).
- H
Correlation of RANKL and LTα expression in thymic LTi cells during the course of BMT. pBMT: post‐bone marrow transplantation. Data are pooled of three independent experiments with similar results (n = 3–4 mice per group).
- I
Expression level of LTα protein in thymic LTi cells from UT WT mice or at d3, d6, d10, and d21 after BMT. Data are pooled of three independent experiments with similar results (n = 3–4 mice per group).
- J
Expression level of LTα protein analyzed by flow cytometry in thymic LTi cells from CD45.1 donor and CD45.2 host origin at d3 and d6 after BMT. Data are pooled of four experiments (n = 3–4 mice per group).
- K
RANKL protein expression in LTi cells from WT and LTα−/− mice at d3 SL‐TBI. Data are pooled of three experiments (n = 3–5 mice per group).
- L
The expression of Ltα and Ltβ mRNAs was measured by qPCR in the total thymus from UT WT mice (n = 4) or at d3 SL‐TBI (n = 4).
- M
MFI of LTα protein in CD45− and CD45+ thymic cells from UT WT (n = 6) mice or at d3 SL‐TBI (n = 6).
- N, O
Representative histogram of LTα (N) and LTβR‐Fc staining (O) in LTi cells from UT WT mice (n = 6) or at d3 SL‐TBI (n = 6) or L‐TBI (n = 6).
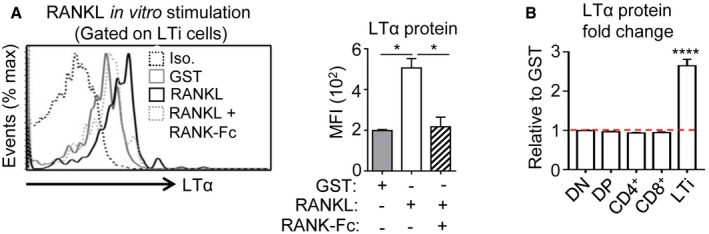
LTα protein expression was analyzed by flow cytometry in thymic LTi cells from sublethally irradiated WT mice treated in vitro for 24 h with GST, RANKL‐GST, or RANKL‐GST + RANK‐Fc. The histogram shows the MFI of LTα for each condition. Iso: Isotype control.
LTα protein was analyzed in DN, DP, CD4+, and CD8+ SP as well as in LTi cells purified from sublethally irradiated WT mice and treated in vitro for 24 h with GST or RANKL‐GST. Results are represented as fold change relative to the GST condition.
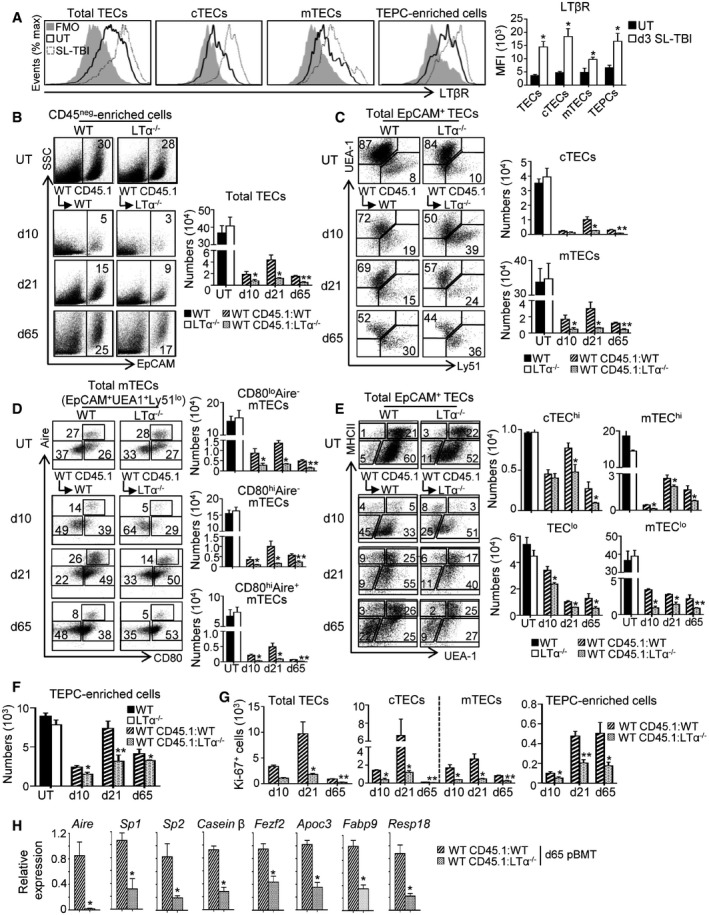
- A
Expression level of LTβR protein in total TECs, cTECs, mTECs, and TEPC‐enriched cells from the thymus of UT WT mice (n = 6) and at d3 SL‐TBI (n = 6) was analyzed by flow cytometry. FMO: Fluorescence Minus One.
- B–F
Flow cytometry profiles and numbers of total TECs (B); cTECs, mTECs (C); mTEC subsets (D); cTEChi, mTEChi, TEClo, mTEClo (E); and TEPC‐enriched cells (F) were analyzed in CD45neg‐enriched cells by AutoMACS from the thymus of UT WT and LTα−/− mice or in WT CD45.1:WT and WT CD45.1:LTα−/− chimeras at d10, d21, and d65 upon BMT.
- G
Numbers of total proliferating Ki‐67+ TECs, cTECs, mTECs, and TEPC‐enriched cells at the indicated time points.
- H
The expression of mRNAs coding for Aire, Aire‐induced TRAs (Sp1 and Sp2); Aire‐independent TRA (casein β); Fezf2 and Fezf2‐induced TRAs (Apoc3, Fabp9, and Resp18) was measured by qPCR in CD45− thymic stromal cells from WT CD45.1:WT and WT CD45.1:LTα−/− mice at d65 after BMT. Significance relative to WT CD45.1:WT chimeras.
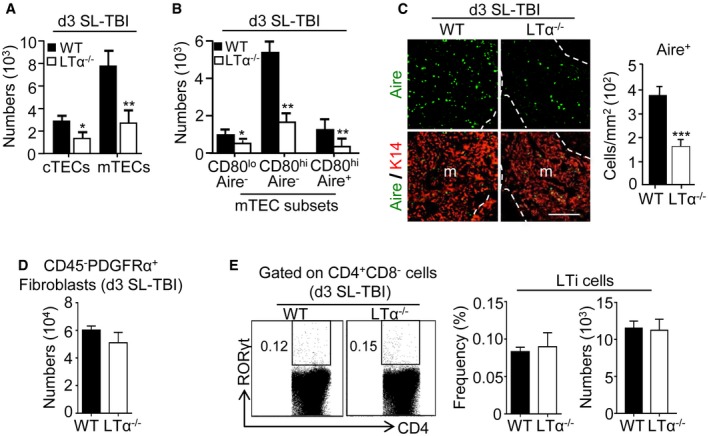
- A, B
Histograms show numbers of cTECs and mTECs (A) as well as mTEC subsets (B) in WT and LTα−/− mice at d3 SL‐TBI.
- C
Thymic sections from WT and LTα−/− mice at d3 SL‐TBI were stained for the expression of K14 and Aire. The histogram shows the density of Aire+ cells in medullary area. m, medulla. Fifteen sections were quantified; scale bar: 100 μm.
- D
The histogram shows numbers of CD45−PDFRα+ fibroblasts in WT and LTα−/− mice at d3 SL‐TBI.
- E
Flow cytometry profiles and frequencies of thymic LTi cells from WT or LTα−/− mice at d3 SL‐TBI.
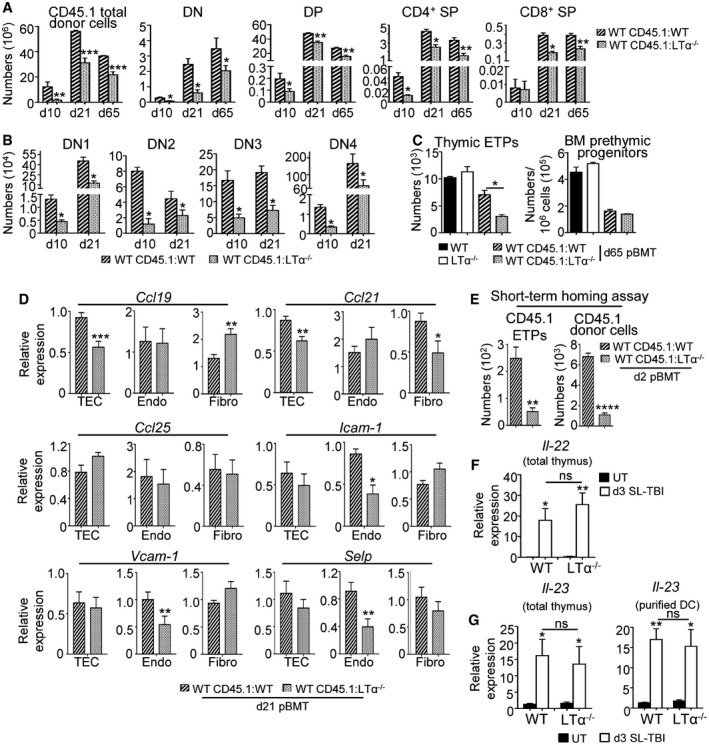
Numbers of total thymic cells and thymocyte subsets of CD45.1 donor origin were analyzed by flow cytometry in WT CD45.1:WT and WT CD45.1:LTα−/− mice at d10, d21, and d65 after BMT.
Numbers of DN1 (CD44+CD25−), DN2 (CD44+CD25+), DN3 (CD44−CD25+), and DN4 (CD44−CD25−) of CD45.1 origin were also analyzed at d10 and d21 after BMT.
Numbers of early thymic progenitors (ETPs; CD4−CD8−CD44+CD25−Lin−CD117+) and BM prethymic progenitors (CD3−CD44+CD25−Lin−CD117+) were analyzed by flow cytometry in UT WT and LTα−/− mice or WT CD45.1:WT and WT CD45.1:LTα−/− chimeras at d65 after BMT.
The expression of Ccl19, Ccl21, Ccl25, Icam‐1, Vcam‐1, and Selp mRNAs was measured by qPCR in purified EpCAM+ TECs, CD31+EpCAM− endothelial cells, and gp38+EpCAM− fibroblasts isolated from WT CD45.1:WT (n = 5) and WT CD45.1:LTα−/− (n = 5) chimeras at d21 after BMT.
Numbers of ETPs and total cells of CD45.1 donor origin in CD45.2 WT or LTα−/− recipients 48 h after i.v. injection of CD45.1 BM cells.
Expression of Il‐22 mRNA in the total thymus isolated from UT WT and LTα−/− mice (n = 4) or at d3 SL‐TBI (n = 4).
Expression of Il‐23 mRNA in the total thymus and purified DCs isolated from UT WT and LTα−/− mice (n = 4) or at d3 SL‐TBI (n = 4).
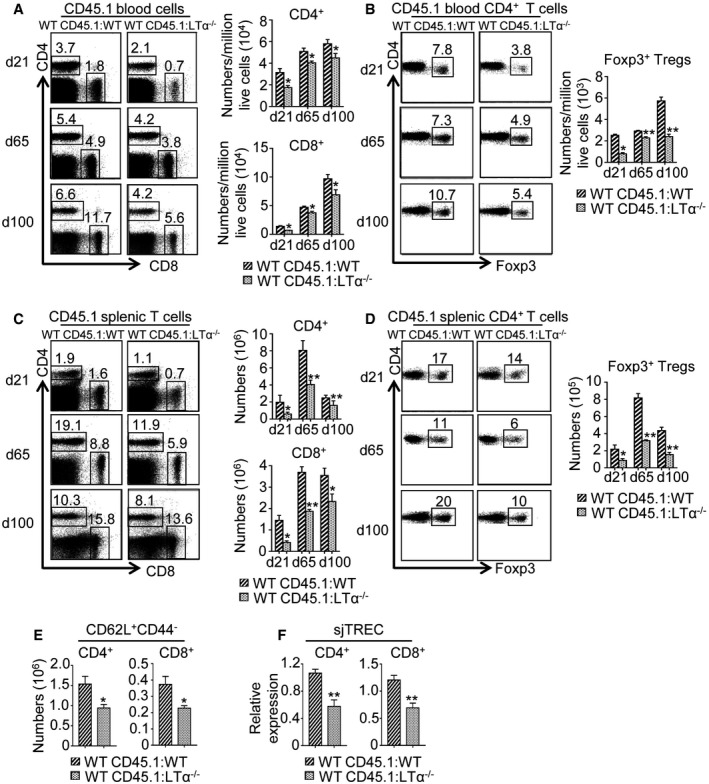
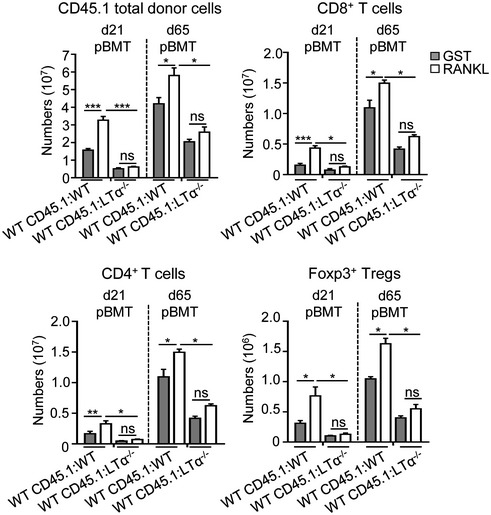
- A–D
Flow cytometry profiles and numbers of CD4+ and CD8+ T cells (A, C) as well as CD4+Foxp3+ Tregs (B, D) from CD45.1 donor origin in blood (A, B) and spleen (C, D) of WT CD45.1:WT and WT CD45.1:LTα−/− mice at d21, d65, and d100 upon BMT. Significance relative to WT CD45.1:WT chimeras.
- E
Histograms show numbers of CD62L+CD44− naïve CD4+ and CD8+ T cells in the spleen of WT CD45.1:WT and WT CD45.1:LTα−/− mice at d21 pBMT.
- F
sjTREC were quantified by qPCR from genomic DNA of cell‐sorted splenic CD4+ and CD8+ T cells from WT CD45.1:WT and WT CD45.1:LTα−/− mice at d21 pBMT.
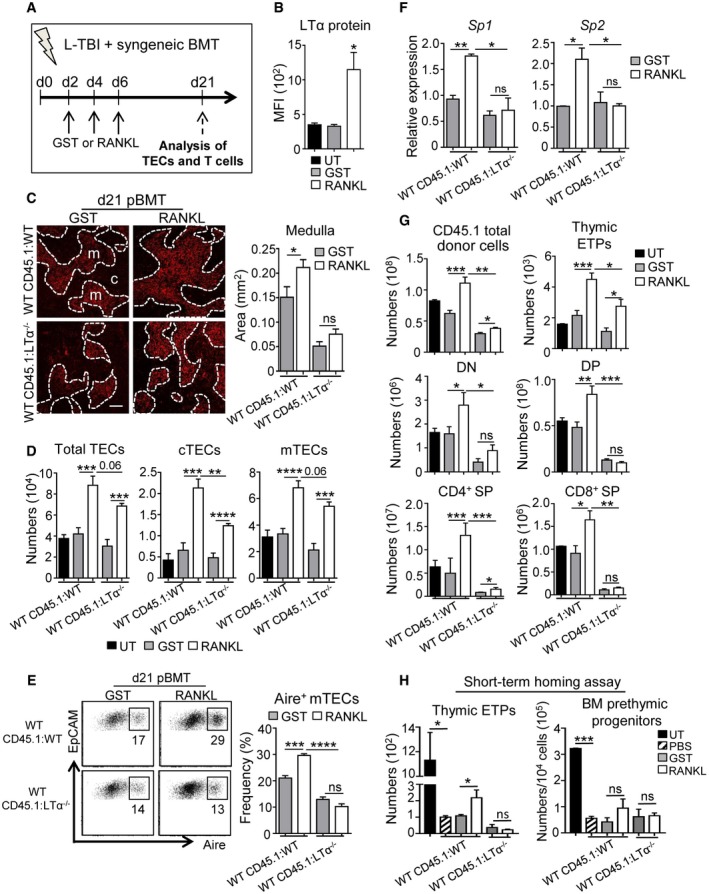
- A
Experimental setup: WT CD45.1:WT and WT CD45.1:LTα−/− chimeras were treated with GST or RANKL‐GST proteins at d2, d4, and d6 after BMT and TEC regeneration and T‐cell reconstitution were analyzed at d21 after BMT.
- B
Expression level of LTα protein in thymic LTi cells in UT mice or treated with GST or RANKL‐GST.
- C
Thymic sections from WT CD45.1:WT and WT CD45.1:LTα−/− mice treated with GST and RANKL at d2, d4, and d6 after BMT were stained for the expression of K14 at d21 pBMT. The histogram shows quantifications of medullary areas. m and c denote the medulla and the cortex, respectively. Twenty sections were quantified for each condition; scale bar: 100 μm.
- D, E
Numbers of total TECs, cTECs, and mTECs (D) and flow cytometry profiles of Aire+ mTECs in total EpCAM+ TECs (E).
- F
Expression of mRNAs coding for TRAs (Sp1 and Sp2) in CD45?thymic stromal cells analyzed by qPCR.
- G
Numbers of total cells and thymocyte subsets of CD45.1 donor origin analyzed in the thymus.
- H
Numbers of ETPs of CD45.1 donor origin in the thymus and prethymic progenitors in the BM from CD45.2 WT or LTα−/− recipients 48 h after i.v. injection of CD45.1 BM cells.
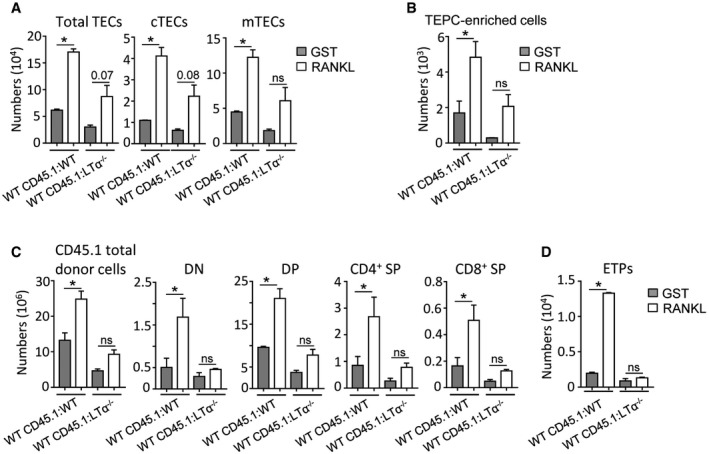
- A, B
Numbers of total TECs, cTECs, mTECs (A), and TEPC‐enriched cells (B) were analyzed at d21 upon BMT in the thymus from WT CD45.1:WT and WT CD45.1:LTα−/− chimeras of 6–8 months of age treated with GST or RANKL proteins.
- C, D
Numbers of total thymic cells, thymocyte subsets (C), and ETPs (D) of CD45.1 origin.
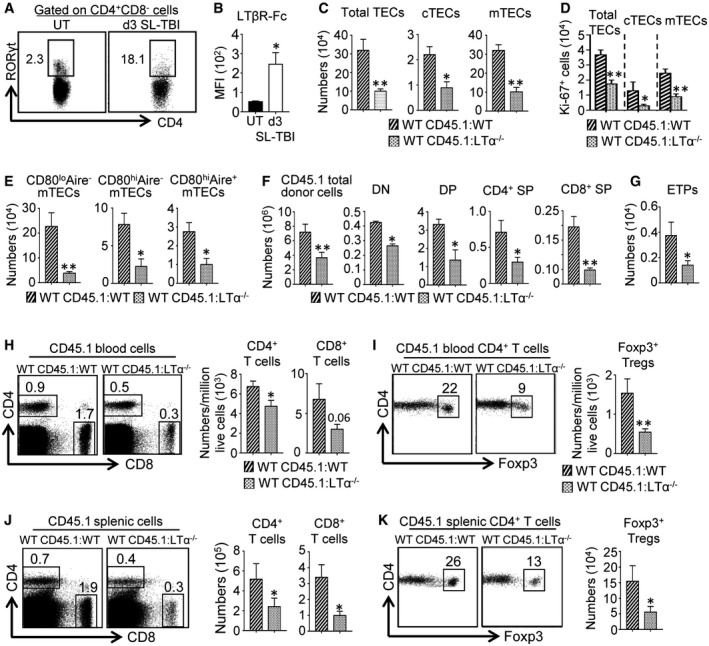
- A
CD4+CD8− thymic cells from 8‐month‐old UT WT mice (n = 9) or at d3 SL‐TBI (n = 6) were analyzed for the expression of RORγt by flow cytometry.
- B
MFI of LTβR‐Fc staining in thymic LTi cells from 6‐ to 8‐month‐old UT WT mice or at d3 SL‐TBI.
- C–G
Histograms show numbers of total TECs, cTECs, mTECs (C); Ki‐67+ TEC subsets (D); mTEC subsets (E); total thymic cells, T‐cell subsets (DN, DP, CD4+ SP, and CD8+ SP) (F); and ETPs (G) in the thymus from WT CD45.1:WT and WT CD45.1:LTα−/− chimeras of 6–8 months of age at d21 upon BMT.
- H–K
Flow cytometry profiles and numbers of CD4+ and CD8+ T cells (H, J) as well as CD4+Foxp3+ Tregs (I, K) from CD45.1 donor origin in blood (H, I) and spleen (J, K) of WT CD45.1:WT and WT CD45.1:LTα−/− mice of 6–8 months of age at d21 pBMT. Significance relative to WT CD45.1:WT chimeras.
References
-
- Adkins B, Gandour D, Strober S, Weissman I (1988) Total lymphoid irradiation leads to transient depletion of the mouse thymic medulla and persistent abnormalities among medullary stromal cells. J Immunol 140: 3373–3379 - PubMed
-
- Akiyama T, Shimo Y, Yanai H, Qin J, Ohshima D, Maruyama Y, Asaumi Y, Kitazawa J, Takayanagi H, Penninger JM et al (2008) The tumor necrosis factor family receptors RANK and CD40 cooperatively establish the thymic medullary microenvironment and self‐tolerance. Immunity 29: 423–437 - PubMed
-
- Anderson MS, Venanzi ES, Klein L, Chen Z, Berzins SP, Turley SJ, von Boehmer H, Bronson R, Dierich A, Benoist C et al (2002) Projection of an immunological self shadow within the thymus by the aire protein. Science 298: 1395–1401 - PubMed
-
- Anderson G, Takahama Y (2012) Thymic epithelial cells: working class heroes for T cell development and repertoire selection. Trends Immunol 33: 256–263 - PubMed
Publication types
MeSH terms
Substances
LinkOut - more resources
Full Text Sources
Other Literature Sources
Medical
Molecular Biology Databases
Research Materials
