

Decorrelated Input Dissociates Narrow Band γ Power and BOLD in Human Visual Cortex
- PMID: 28455370
- PMCID: PMC6596528
- DOI: 10.1523/JNEUROSCI.3938-16.2017
Decorrelated Input Dissociates Narrow Band γ Power and BOLD in Human Visual Cortex
Abstract
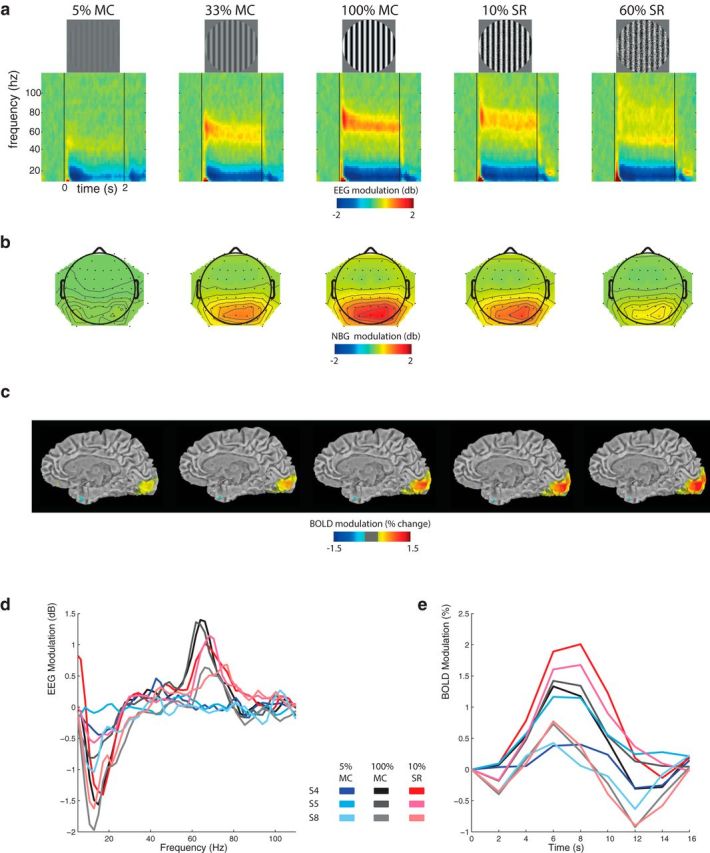
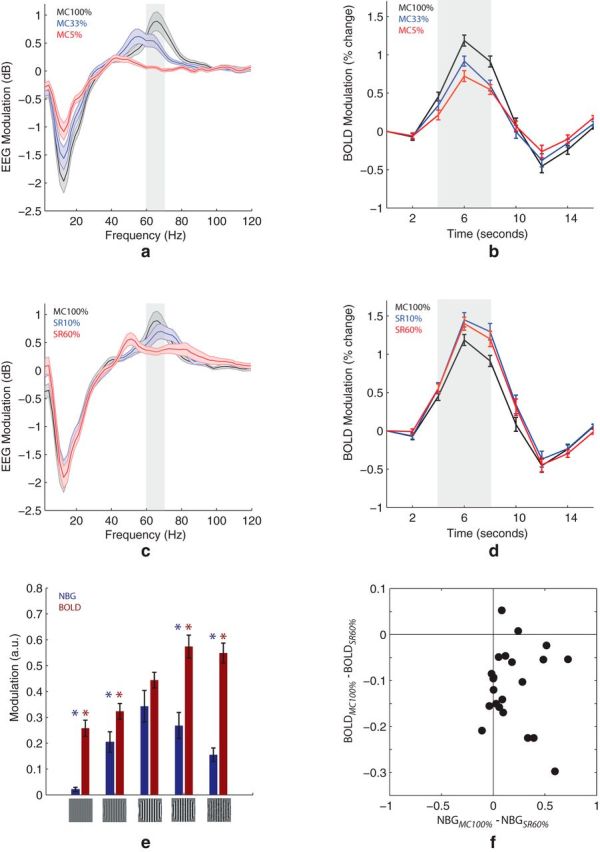
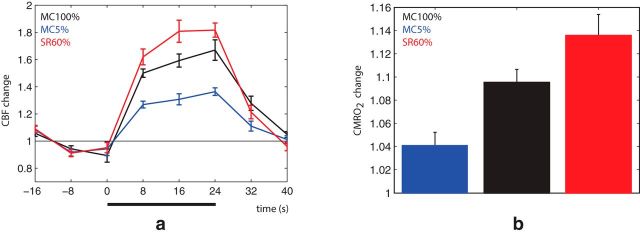
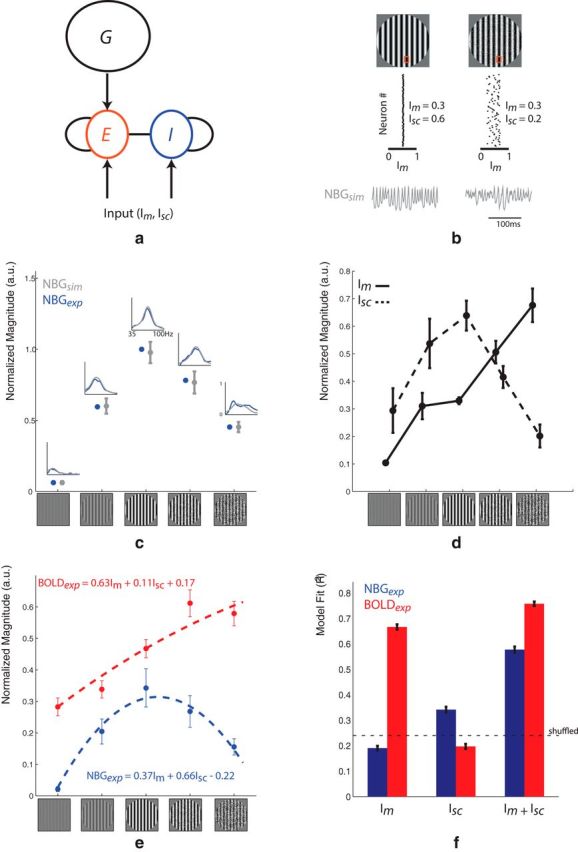
Although fMRI using the BOLD contrast is widely used for noninvasively mapping hemodynamic brain activity in humans, its exact link to underlying neural processing is poorly understood. Whereas some studies have reported that BOLD signals measured in visual cortex are tightly linked to neural activity in the narrow band γ (NBG) range, others have found a weak correlation between the two. To elucidate the mechanisms behind these conflicting findings, we hypothesized that BOLD reflects the strength of synaptic inputs to cortex, whereas NBG is more dependent on how well these inputs are correlated. To test this, we measured NBG, BOLD, and cerebral blood flow responses to stimuli that either correlate or decorrelate neural activity in human visual cortex. Next, we simulated a recurrent network model of excitatory and inhibitory neurons that reproduced in detail the experimental NBG and BOLD data. Results show that the visually evoked BOLD response was solely predicted by the sum of local inputs, whereas NBG was critically dependent on how well these inputs were correlated. In summary, the NBG-BOLD relationship strongly depends on the nature of sensory input to cortex: stimuli that increase the number of correlated inputs to visual cortex will increase NBG and BOLD in a similar manner, whereas stimuli that increase the number of decorrelated inputs will dissociate the two. The NBG-BOLD relationship is therefore not fixed but is rather highly dependent on input correlations that are both stimulus- and state-dependent.SIGNIFICANCE STATEMENT It is widely believed that γ oscillations in cortex are tightly linked to local hemodynamic activity. Here, we present experimental evidence showing how a stimulus can increase local blood flow to the brain despite suppressing γ power. Moreover, using a sophisticated model of cortical neurons, it is proposed that this occurs when synaptic input to cortex is strong yet decorrelated. Because input correlations are largely determined by the state of the brain, our results demonstrate that the relationship between γ and local hemodynamics is not fixed, but rather context dependent. This likely explains why certain neurodevelopmental disorders are characterized by weak γ activity despite showing normal blood flow.
Keywords: CBF; EEG; fMRI; synaptic input.
Copyright © 2017 the authors 0270-6474/17/375408-11$15.00/0.
Figures
Similar articles
-
Stimulus-induced gamma power predicts the amplitude of the subsequent visual evoked response.Neuroimage. 2019 Feb 1;186:703-712. doi: 10.1016/j.neuroimage.2018.11.029. Epub 2018 Nov 20. Neuroimage. 2019. PMID: 30468771
-
Biased Orientation and Color Tuning of the Human Visual Gamma Rhythm.J Neurosci. 2022 Feb 9;42(6):1054-1067. doi: 10.1523/JNEUROSCI.1085-21.2021. Epub 2021 Dec 28. J Neurosci. 2022. PMID: 34965979 Free PMC article.
-
Cortical layer-dependent dynamic blood oxygenation, cerebral blood flow and cerebral blood volume responses during visual stimulation.Neuroimage. 2008 Oct 15;43(1):1-9. doi: 10.1016/j.neuroimage.2008.06.029. Epub 2008 Jul 4. Neuroimage. 2008. PMID: 18655837 Free PMC article.
-
Modelling the effects of ongoing alpha activity on visual perception: The oscillation-based probability of response.Neurosci Biobehav Rev. 2020 May;112:242-253. doi: 10.1016/j.neubiorev.2020.01.037. Epub 2020 Feb 2. Neurosci Biobehav Rev. 2020. PMID: 32023485 Review.
-
Alpha-band oscillations in visual cortex: part of the neural correlate of visual awareness?Int J Psychophysiol. 1999 Apr;32(1):35-45. doi: 10.1016/s0167-8760(98)00062-2. Int J Psychophysiol. 1999. PMID: 10192006 Review.
Cited by
-
Average firing rate rather than temporal pattern determines metabolic cost of activity in thalamocortical relay neurons.Sci Rep. 2019 May 6;9(1):6940. doi: 10.1038/s41598-019-43460-8. Sci Rep. 2019. PMID: 31061521 Free PMC article.
-
Temporal coupling of field potentials and action potentials in the neocortex.Eur J Neurosci. 2018 Oct;48(7):2482-2497. doi: 10.1111/ejn.13807. Epub 2018 Jan 24. Eur J Neurosci. 2018. PMID: 29250852 Free PMC article.
-
A visual encoding model links magnetoencephalography signals to neural synchrony in human cortex.Neuroimage. 2021 Dec 15;245:118655. doi: 10.1016/j.neuroimage.2021.118655. Epub 2021 Oct 21. Neuroimage. 2021. PMID: 34687857 Free PMC article.
-
The relationship between electrophysiological and hemodynamic measures of neural activity varies across picture naming tasks: A multimodal magnetoencephalography-functional magnetic resonance imaging study.Front Neurosci. 2022 Nov 3;16:1019572. doi: 10.3389/fnins.2022.1019572. eCollection 2022. Front Neurosci. 2022. PMID: 36408411 Free PMC article.
-
Determining Excitatory and Inhibitory Neuronal Activity from Multimodal fMRI Data Using a Generative Hemodynamic Model.Front Neurosci. 2017 Nov 10;11:616. doi: 10.3389/fnins.2017.00616. eCollection 2017. Front Neurosci. 2017. PMID: 29249925 Free PMC article.
References
-
- Bartolo MJ, Gieselmann MA, Vuksanovic V, Hunter D, Sun L, Chen X, Delicato LS, Thiele A (2011) Stimulus-induced dissociation of neuronal firing rates and local field potential gamma power and its relationship to the resonance blood oxygen level-dependent signal in macaque primary visual cortex. Eur J Neurosci 34:1857–1870. 10.1111/j.1460-9568.2011.07877.x - DOI - PMC - PubMed
Publication types
MeSH terms
LinkOut - more resources
Full Text Sources
Other Literature Sources