. 2017 Apr 28;7(1):1253.
doi: 10.1038/s41598-017-01324-z.

Lamins and nesprin-1 mediate inside-out mechanical coupling in muscle cell precursors through FHOD1

Affiliations

Lamins and nesprin-1 mediate inside-out mechanical coupling in muscle cell precursors through FHOD1

Christine Schwartz et al. Sci Rep. .

Abstract

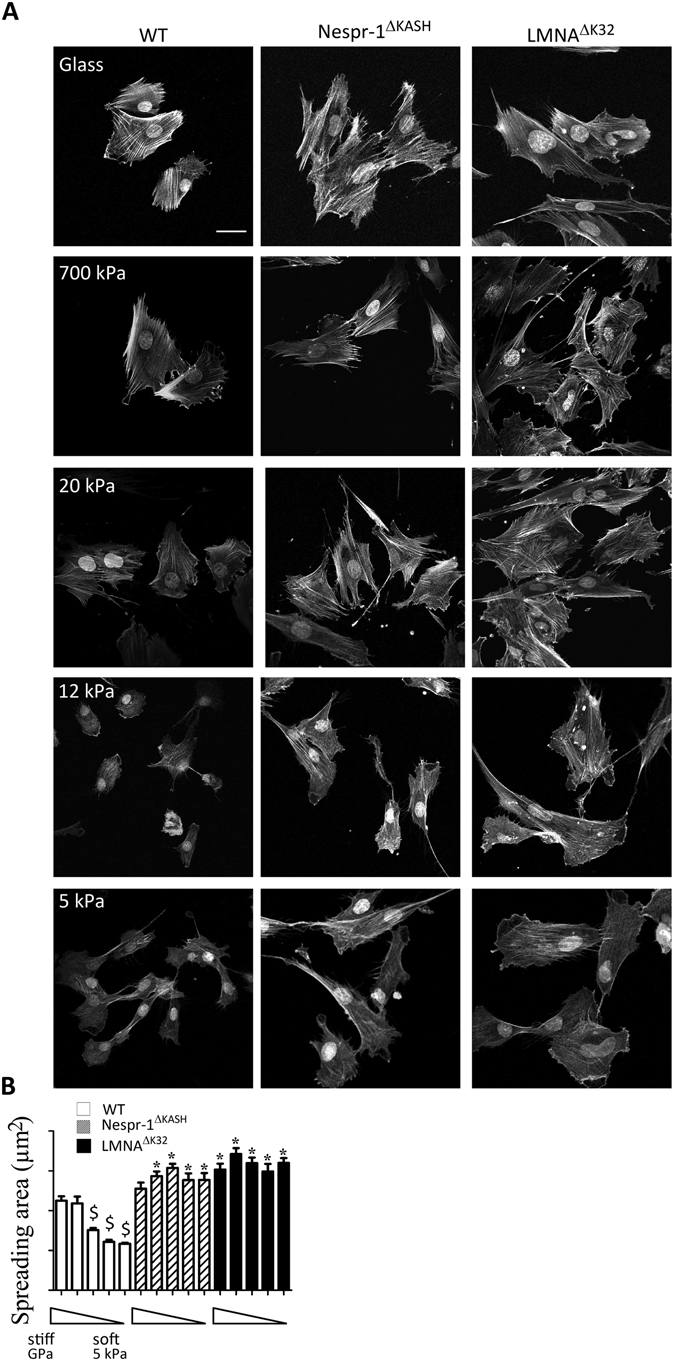
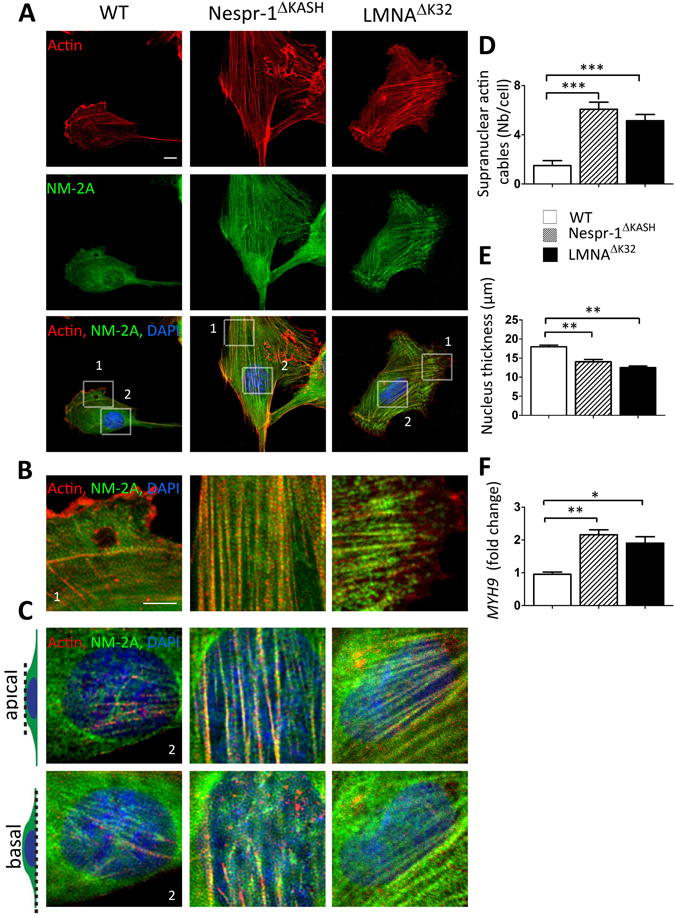
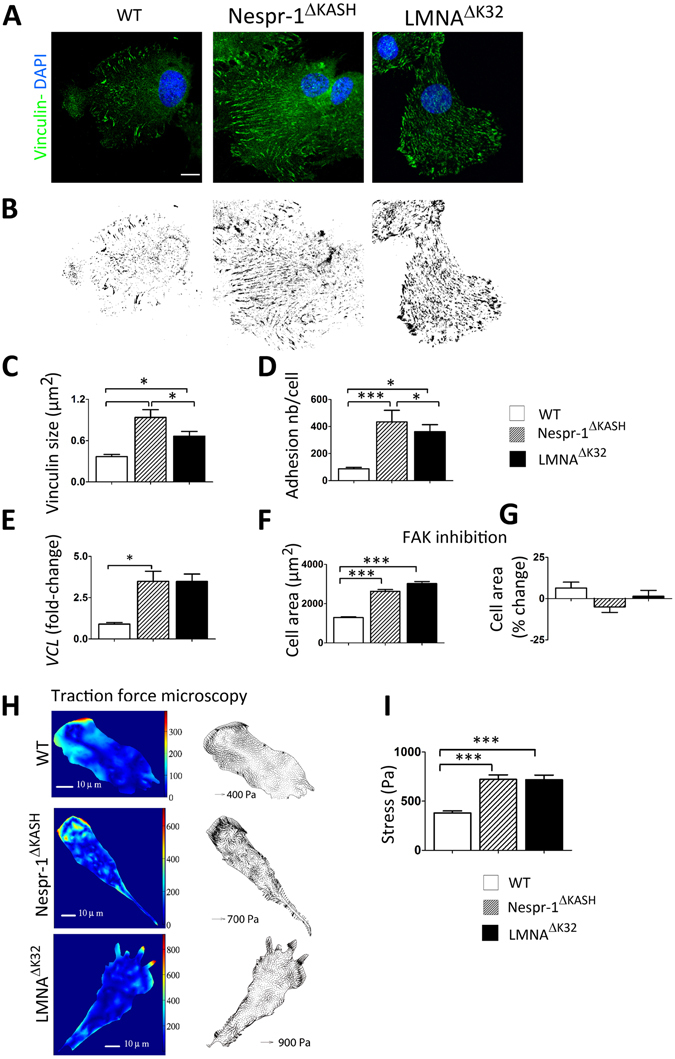
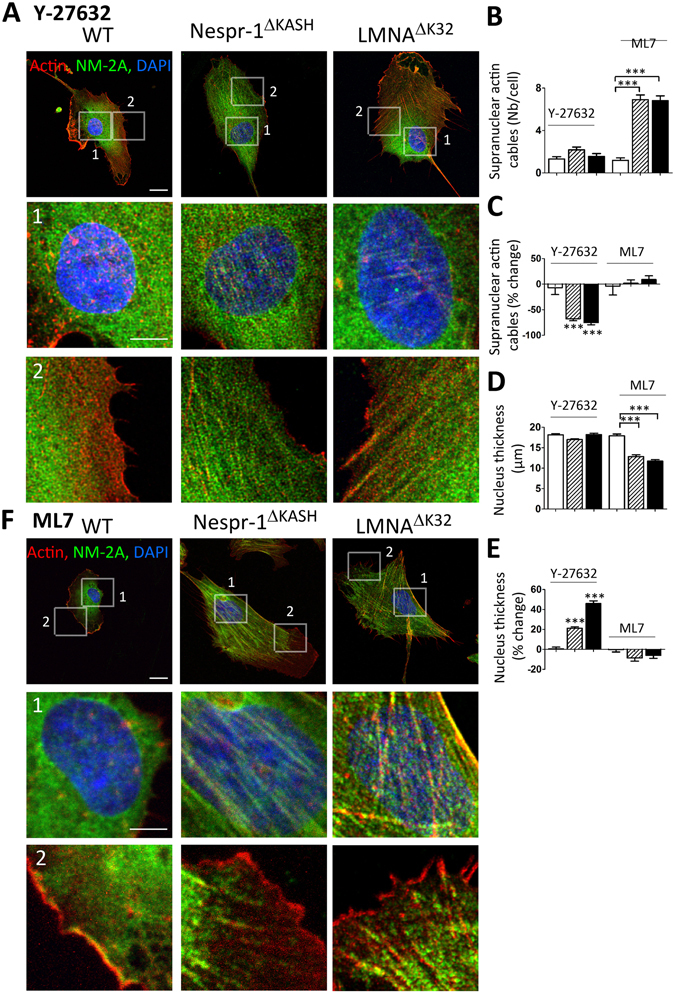
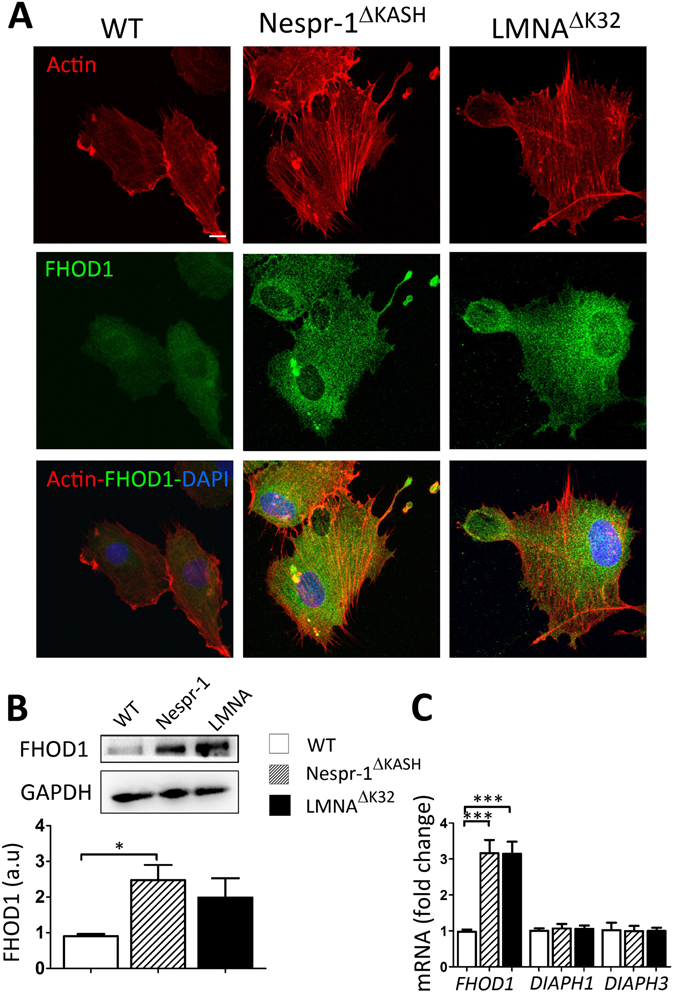
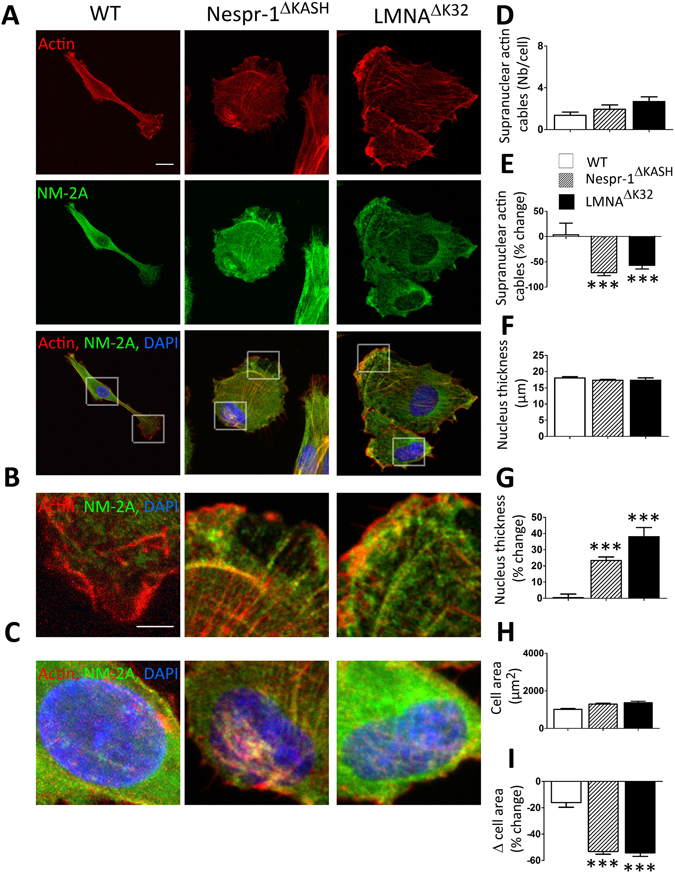
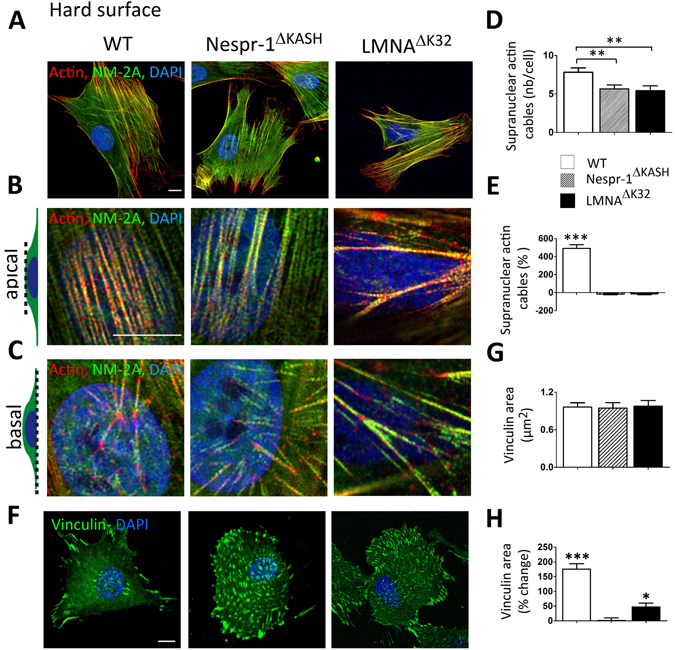
LINC complexes are crucial for the response of muscle cell precursors to the rigidity of their environment, but the mechanisms explaining this behaviour are not known. Here we show that pathogenic mutations in LMNA or SYNE-1 responsible for severe muscle dystrophies reduced the ability of human muscle cell precursors to adapt to substrates of different stiffness. Plated on muscle-like stiffness matrix, mutant cells exhibited contractile stress fibre accumulation, increased focal adhesions, and higher traction force than controls. Inhibition of Rho-associated kinase (ROCK) prevented cytoskeletal defects, while inhibiting myosin light chain kinase or phosphorylation of focal adhesion kinase was ineffective. Depletion or inactivation of a ROCK-dependent regulator of actin remodelling, the formin FHOD1, largely rescued morphology in mutant cells. The functional integrity of lamin and nesprin-1 is thus required to modulate the FHOD1 activity and the inside-out mechanical coupling that tunes the cell internal stiffness to match that of its soft, physiological-like environment.


Conflict of interest statement

The authors declare that they have no competing interests.

Figures

Figure 1
Figure 1
Cell responses to different substrate stiffness. (A) Phalloidin staining of the F-actin of fixed WT, Nespr-1ΔKASH and LMNAΔK32 myoblasts on fibronectin-coated glass and gel substrates of 700 kPa, 20 kPa, 12 kPa and 5 kPa. Nuclei are stained with DAPI. Scale bar: 40 µm. (B) Projected cell area as a function of substrate stiffness. Analysis was performed on glass and gel substrates of 700 kPa, 20 kPa, 12 kPa, and 5 kPa (each n > 50 cells). Values are means ± SEM; $p < 0.001 vs corresponding cell line value on glass; *p < 0.001 vs WT value at similar substrate rigidity.
Figure 2
Figure 2
Actin cytoskeleton on soft matrix (12 kPa). (A) Confocal images of WT, Nespr-1ΔKASH and LMNAΔK32 myoblasts on soft matrix (12 kPa) close to physiological muscle stiffness and stained for F-actin (phalloidin, red) and non-muscle myosin 2 A (NM-2A, green). Nuclei are stained with DAPI (blue). Scale bar: 10 µm. (B,C) Zoom-in of actin cytoskeleton at the cell periphery (B) and in the perinuclear regions (C). In C, confocal images are taken at the apical and basal surface of the cell. Scale bar: 5 µm. (D) Supranuclear actin cable number in WT, Nespr-1ΔKASH and LMNAΔK32 myoblasts. Values are means ± SEM; ***p < 0.001 compared with WT. (E) Nuclear thickness in WT, Nespr-1ΔKASH and LMNAΔK32 myoblasts. Values are means ± SEM; **p < 0.01 compared with WT. (F) mRNA expression of MYH9 gene expression coding for NM-2A in WT, Nespr-1ΔKASH and LMNAΔK32 myoblasts. Values are means ± SEM; **p < 0.01, *p < 0.05 compared with WT.
Figure 3
Figure 3
Cell matrix adhesions on soft matrix (12 kPa). (A) Confocal images of WT, Nespr-1ΔKASH and LMNAΔK32 myoblasts on soft matrix (12 kPa) and stained with antibody against vinculin (green). Nuclei are stained with DAPI (blue). Scale bar: 10 µm. (B) Binary images of vinculin staining obtained from A. (C,D) Quantification of vinculin size (C) and number of focal adhesions per cell (D) in WT, Nespr-1ΔKASH and LMNAΔK32 myoblasts obtained from binary images. Values are means ± SEM in at least 12 myoblasts per line; *p < 0.05, **p < 0.01, ***p < 0.001 compared with WT. (E) Histogram of VCL mRNA expression in WT, Nespr-1ΔKASH and LMNAΔK32 myoblasts. Values are means ± SEM; *p < 0.05 compared with WT and expressed in arbitrary units (au). Values are means ± SEM, n = 5 in each cell line from 2 separate experiments. (F,G) Effects of FAK phosphorylation inhibition on cell spreading in WT, Nespr-1ΔKASH and LMNAΔK32 myoblasts. Values are expressed as µm2 (F) and as percent of baseline values for each cell line (G). At least 50 cells of each type were measured, ***p < 0.001 compared with WT. (H,I) Traction force microscopy in WT, Nespr-1ΔKASH and LMNAΔK32 myoblasts. (H) Typical images of traction isostresses (Pa) and traction stress vectors (Pa) in WT, Nespr-1ΔKASH and LMNAΔK32 myoblasts. (I) Mean values ± SEM obtained from n ≥ 9 in each cell line; ***p < 0.001 compared with WT.
Figure 4
Figure 4
Effects of ROCK and MLCK inhibition on actin cytoskeleton in myoblasts on soft matrix (12 kPa). (A,F) Confocal images of WT, Nespr-1ΔKASH and LMNAΔK32 myoblasts on soft matrix and stained for F-actin (phalloidin, red) and NM-2A (green) after treatment with the ROCK inhibitor Y-27632 (A), and the MLCK inhibitor ML7 (F). Nuclei are stained with DAPI (blue). Scale bar: 10 µm. Images 1 and 2 show higher magnification of the perinuclear and periphery zones respectively. Zoom-in scale bar: 5 µm. (B,C) Supranuclear actin cable number in WT, Nespr-1ΔKASH and LMNAΔK32 myoblasts after treatment with Y-27632 or ML7. Values are expressed as absolute numbers (B) and as percent of baseline values for each cell line (C). (D,E) Nucleus thickness in WT, Nespr-1ΔKASH and LMNAΔK32 myoblasts after treatment with Y-27632 or ML7. Values are expressed as absolute numbers (B) and as percent of baseline values for each cell line (C). In (BE), values are means ± SEM; ***p < 0.001 compared with WT (B,D) or compared to values before treatment (C,E). Only significant difference is figured.
Figure 5
Figure 5
FHOD1 expression in myoblasts on soft matrix (12 kPa). (A) Confocal images of WT, Nespr-1ΔKASH and LMNAΔK32 myoblasts on soft matrix and stained for F-actin (phalloidin, red) and FHOD1 (green). Nuclei are stained with DAPI (blue). (B) Representative western-blot of FHOD1 in WT, Nespr-1ΔKASH and LMNAΔK32 myoblasts cultured on soft substrates. Histogram represents FHOD1 quantifications obtained in WT, Nespr-1ΔKASH and LMNAΔK32 myoblasts and normalized by GAPDH. Values are means ± SEM, n = 6 in WT, Nespr-1ΔKASH and LMNAΔK32 myoblasts; *p < 0.05. Only significant difference is figured; au: arbitrary units. (C) Histogram represent mRNA concentrations of FHOD1, DIAPH1 and DIAPH3 normalized to β2 microglobulin expression and expressed in arbitrary units (au). Values are means ± SEM, n = 5 in WT, Nespr-1ΔKASH and LMNAΔK32 myoblasts, ***p < 0.001 compared with WT. Only significant difference is figured.
Figure 6
Figure 6
siRNA against FHOD1 reduced actin contractility and nucleus thickness in myoblasts on soft matrix (12 kPa). (A) Confocal images of WT, Nespr-1ΔKASH and LMNAΔK32 myoblasts on soft matrix and stained for F-actin (phalloidin, red) and NM-2A (green) after siRNA against FHOD1. Scale bar: 10 µm (B,C) Zoom-in of actin cytoskeleton at cell periphery (B) and in the perinuclear regions (C). Scale bar: 10 µm. (D,E) Supranuclear actin cable number in WT, Nespr-1ΔKASH and LMNAΔK32 myoblasts after siRNA against FHOD1. Values are expressed as absolute numbers (D) and as percent of baseline values for each cell line (E). Values are means ± SEM, n ≥ 19 in WT, Nespr-1ΔKASH and LMNAΔK32 myoblasts, ***p < 0.001 compared to values before siRNA against FHOD1. Only significant difference is figured. (F,G) Nuclear thickness in WT, Nespr-1ΔKASH and LMNAΔK32 myoblasts after siRNA against FHOD1. Values are means ± SEM. n ≥ 19 in WT, Nespr-1ΔKASH and LMNAΔK32 myoblasts, ***p < 0.001 compared to values before siRNA against FHOD1. Only significant difference is figured. (H,I) Cell spreading area in WT, Nespr-1ΔKASH and LMNAΔK32 myoblasts after siRNA against FHOD1. Values are expressed as absolute values (H) and as percent of baseline values for each cell line (I). Values are means ± SEM, n ≥ 50 cells in each line; ***p < 0.001 compared to values before siRNA against FHOD1. Only significant difference is figured.
Figure 7
Figure 7
Impaired ability to sustain high external force in Nespr-1ΔKASH and LMNAΔK32 cells. (A) Confocal images of WT, Nespr-1ΔKASH and LMNAΔK32 myoblasts on fibronectin-coated rigid matrix (glass) and stained for F-actin (phalloidin, red) and non-muscle myosin IIA (NM-2A, green). Nuclei are stained with DAPI (blue). Scale bar: 10 µm. (B,C) Zoom-in of actin cytoskeleton in the perinuclear regions. Confocal images were taken at the apical (B) and basal (C) surface of the cell. (D,E) Supranuclear actin cable number on hard surface in WT, Nespr-1ΔKASH and LMNAΔK32 myoblasts. Values expressed as absolute values (D) and as percent changes versus values obtained at 12 kPa (E). Values are means ± SEM. n ≥ 20 in WT, Nespr-1ΔKASH and LMNAΔK32 myoblasts, ***p < 0.01 vs WT. Only significant difference is figured (FH) Cell matrix adhesions on hard surface. (F) Confocal images of WT, Nespr-1ΔKASH and LMNAΔK32 myoblasts on hard matrix (glass) and stained with antibody against vinculin (green). Nuclei are stained with DAPI (blue). Scale bar: 10 µm. (G,H) Histograms of vinculin area in WT, Nespr-1ΔKASH and LMNAΔK32 myoblasts, expressed as absolute values (G) and as percent changes versus values obtained at 12 kPa (H). At least 50 cells of each type were analysed. *p < 0.05 and ***p < 0.001 compared with corresponding value obtained on 12 kPa substrate. Only significant difference is figured.

References

    1. Crisp M, et al. Coupling of the nucleus and cytoplasm: role of the LINC complex. J Cell Biol. 2006;172:41–53. doi: 10.1083/jcb.200509124. - DOI - PMC - PubMed
    1. Sosa BA, Rothballer A, Kutay U, Schwartz TU. LINC complexes form by binding of three KASH peptides to domain interfaces of trimeric SUN proteins. Cell. 2012;149:1035–1047. doi: 10.1016/j.cell.2012.03.046. - DOI - PMC - PubMed
    1. Simon DN, Wilson KL. The nucleoskeleton as a genome-associated dynamic ‘network of networks’. Nat Rev Mol Cell Biol. 2011;12:695–708. doi: 10.1038/nrm3207. - DOI - PubMed
    1. Haque F, et al. SUN1 interacts with nuclear lamin A and cytoplasmic nesprins to provide a physical connection between the nuclear lamina and the cytoskeleton. Mol Cell Biol. 2006;26:3738–3751. doi: 10.1128/MCB.26.10.3738-3751.2006. - DOI - PMC - PubMed
    1. Gundersen GG, Worman HJ. Nuclear positioning. Cell. 2013;152:1376–1389. doi: 10.1016/j.cell.2013.02.031. - DOI - PMC - PubMed

Publication types

LinkOut - more resources