

Role of activating transcription factor 4 in the hepatic response to amino acid depletion by asparaginase
- PMID: 28455513
- PMCID: PMC5430736
- DOI: 10.1038/s41598-017-01041-7
Role of activating transcription factor 4 in the hepatic response to amino acid depletion by asparaginase
Abstract
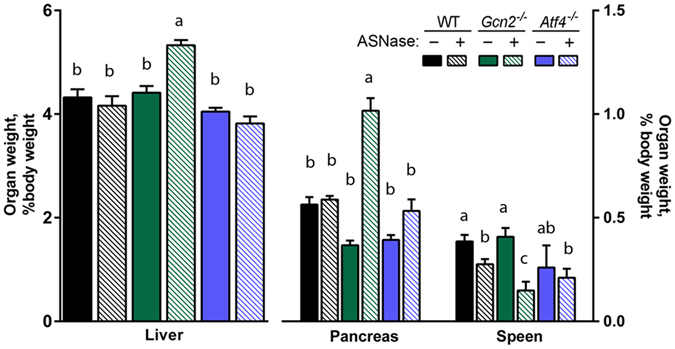
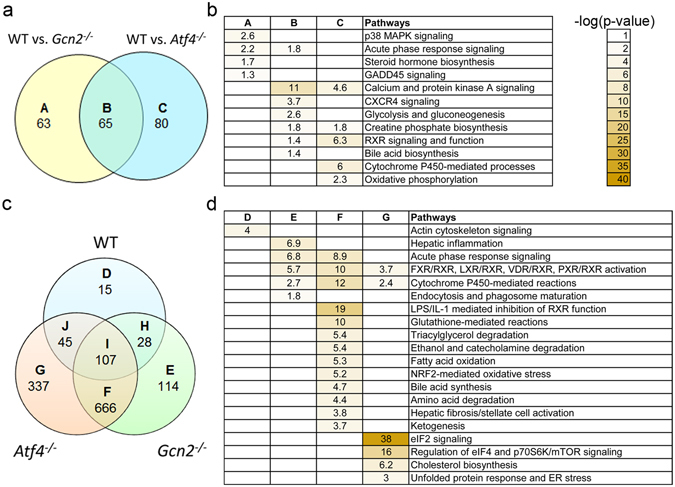
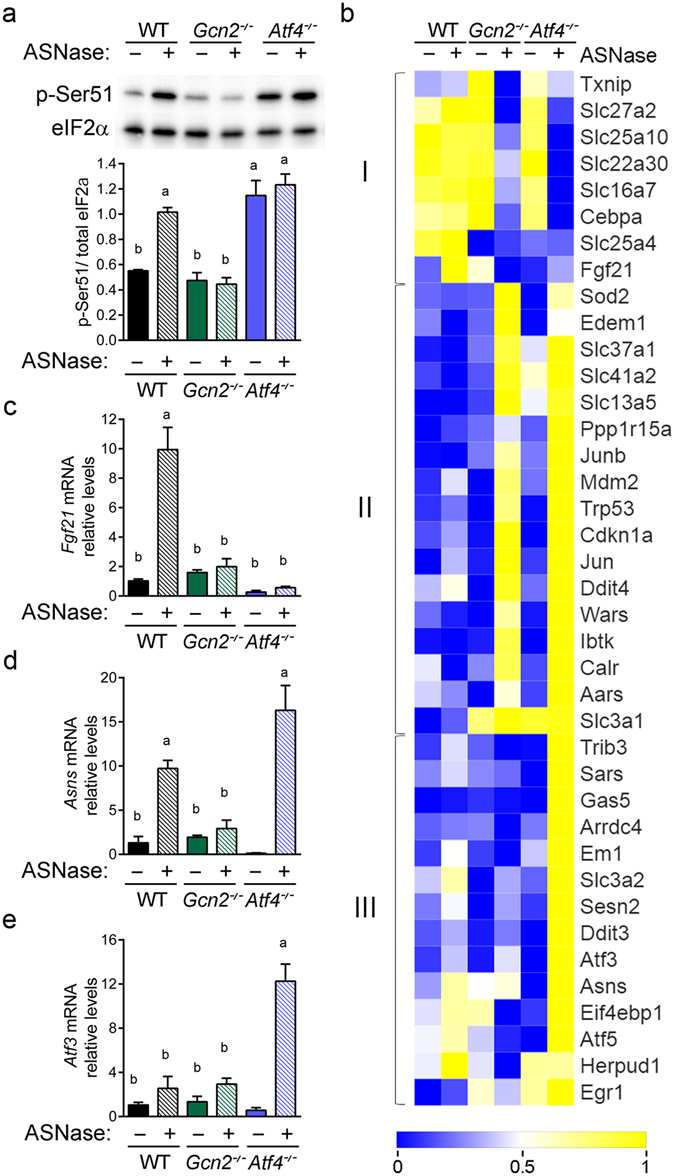
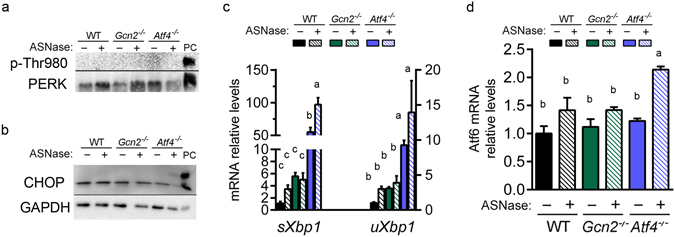
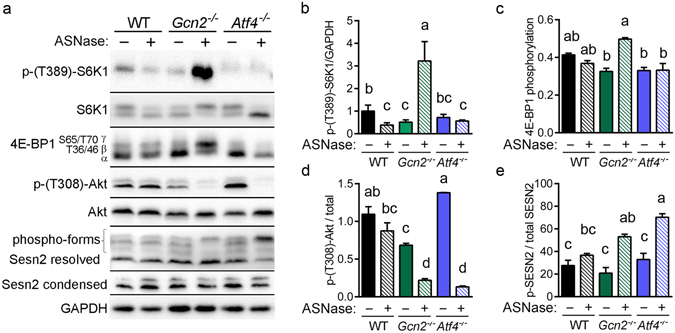
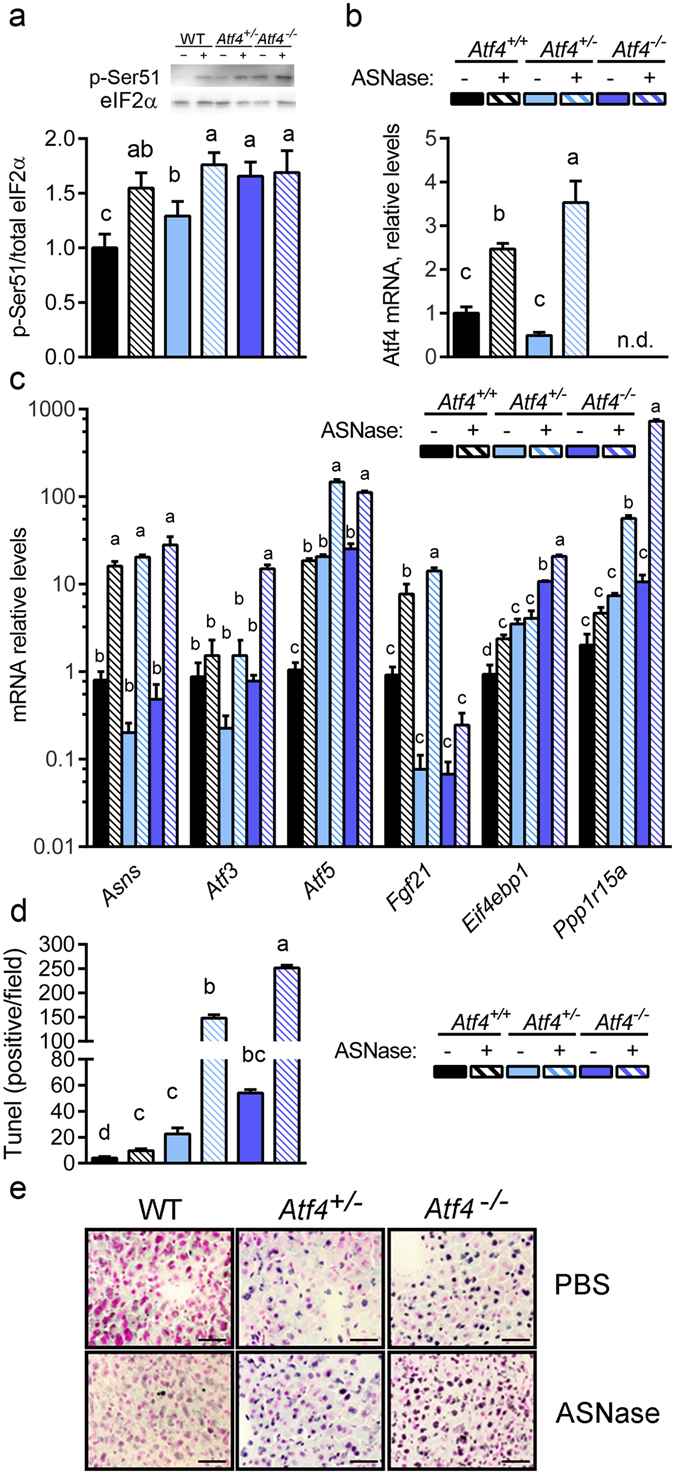
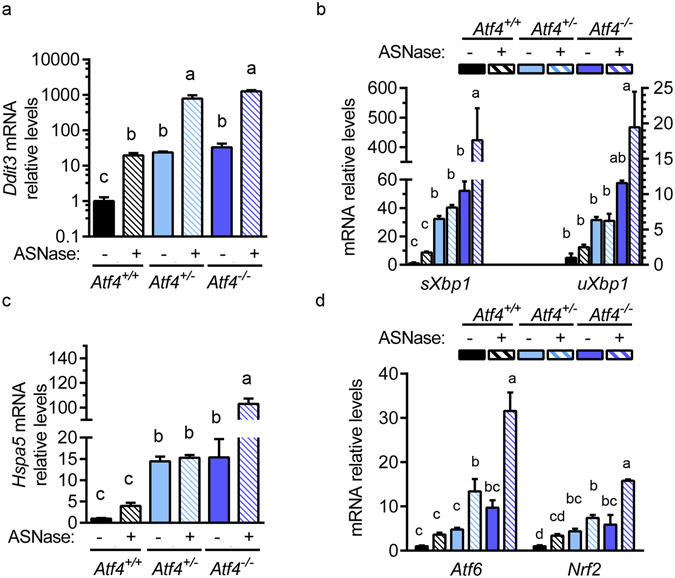
The anti-leukemic agent asparaginase activates the integrated stress response (ISR) kinase GCN2 and inhibits signaling via mechanistic target of rapamycin complex 1 (mTORC1). The study objective was to investigate the protective role of activating transcription factor 4 (ATF4) in controlling the hepatic transcriptome and mediating GCN2-mTORC1 signaling during asparaginase. We compared global gene expression patterns in livers from wildtype, Gcn2 -/-, and Atf4 -/- mice treated with asparaginase or excipient and further explored selected responses in livers from Atf4 +/- mice. Here, we show that ATF4 controls a hepatic gene expression profile that overlaps with GCN2 but is not required for downregulation of mTORC1 during asparaginase. Ingenuity pathway analysis indicates GCN2 independently influences inflammation-mediated hepatic processes whereas ATF4 uniquely associates with cholesterol metabolism and endoplasmic reticulum (ER) stress. Livers from Atf4 -/- or Atf4 +/- mice displayed an amplification of the amino acid response and ER stress response transcriptional signatures. In contrast, reduction in hepatic mTORC1 signaling was retained in Atf4 -/- mice treated with asparaginase.
Conclusions: GCN2 and ATF4 serve complementary roles in the hepatic response to asparaginase. GCN2 functions to limit inflammation and mTORC1 signaling whereas ATF4 serves to limit the amino acid response and prevent ER stress during amino acid depletion by asparaginase.
Conflict of interest statement
The authors declare that they have no competing interests.
Figures
Similar articles
-
Obesity challenges the hepatoprotective function of the integrated stress response to asparaginase exposure in mice.J Biol Chem. 2017 Apr 21;292(16):6786-6798. doi: 10.1074/jbc.M116.768408. Epub 2017 Feb 27. J Biol Chem. 2017. PMID: 28242759 Free PMC article.
-
Time-resolved analysis of amino acid stress identifies eIF2 phosphorylation as necessary to inhibit mTORC1 activity in liver.J Biol Chem. 2018 Apr 6;293(14):5005-5015. doi: 10.1074/jbc.RA117.001625. Epub 2018 Feb 15. J Biol Chem. 2018. PMID: 29449374 Free PMC article.
-
GCN2 protein kinase is required to activate amino acid deprivation responses in mice treated with the anti-cancer agent L-asparaginase.J Biol Chem. 2009 Nov 20;284(47):32742-9. doi: 10.1074/jbc.M109.047910. Epub 2009 Sep 25. J Biol Chem. 2009. PMID: 19783659 Free PMC article.
-
ATF4-dependent transcription mediates signaling of amino acid limitation.Trends Endocrinol Metab. 2009 Nov;20(9):436-43. doi: 10.1016/j.tem.2009.05.008. Epub 2009 Sep 30. Trends Endocrinol Metab. 2009. PMID: 19800252 Free PMC article. Review.
-
ATF4, an ER stress and hypoxia-inducible transcription factor and its potential role in hypoxia tolerance and tumorigenesis.Curr Mol Med. 2009 May;9(4):411-6. doi: 10.2174/156652409788167096. Curr Mol Med. 2009. PMID: 19519398 Review.
Cited by
-
Physiologic Responses to Dietary Sulfur Amino Acid Restriction in Mice Are Influenced by Atf4 Status and Biological Sex.J Nutr. 2021 Apr 8;151(4):785-799. doi: 10.1093/jn/nxaa396. J Nutr. 2021. PMID: 33512502 Free PMC article.
-
Age modulates liver responses to asparaginase-induced amino acid stress in mice.J Biol Chem. 2019 Sep 20;294(38):13864-13875. doi: 10.1074/jbc.RA119.009864. Epub 2019 Aug 14. J Biol Chem. 2019. PMID: 31413113 Free PMC article.
-
Stress-induced perturbations in intracellular amino acids reprogram mRNA translation in osmoadaptation independently of the ISR.Cell Rep. 2022 Jul 19;40(3):111092. doi: 10.1016/j.celrep.2022.111092. Cell Rep. 2022. PMID: 35858571 Free PMC article.
-
ZBTB1 Regulates Asparagine Synthesis and Leukemia Cell Response to L-Asparaginase.Cell Metab. 2020 Apr 7;31(4):852-861.e6. doi: 10.1016/j.cmet.2020.03.008. Cell Metab. 2020. PMID: 32268116 Free PMC article.
-
Serine, glycine and one‑carbon metabolism in cancer (Review).Int J Oncol. 2021 Feb;58(2):158-170. doi: 10.3892/ijo.2020.5158. Epub 2020 Dec 11. Int J Oncol. 2021. PMID: 33491748 Free PMC article. Review.
References
-
- Panosyan EH, et al. Deamination of glutamine is a prerequisite for optimal asparagine deamination by asparaginases in vivo (CCG-1961) Anticancer Res. 2004;24:1121–1125. - PubMed
Publication types
MeSH terms
Substances
Grants and funding
LinkOut - more resources
Full Text Sources
Other Literature Sources
Molecular Biology Databases
