. 2017 Aug;16(4):661-671.
doi: 10.1111/acel.12592. Epub 2017 Apr 28.

Quantitative identification of senescent cells in aging and disease

Affiliations

Quantitative identification of senescent cells in aging and disease

Anat Biran et al. Aging Cell. 2017 Aug.

Abstract

Senescent cells are present in premalignant lesions and sites of tissue damage and accumulate in tissues with age. In vivo identification, quantification and characterization of senescent cells are challenging tasks that limit our understanding of the role of senescent cells in diseases and aging. Here, we present a new way to precisely quantify and identify senescent cells in tissues on a single-cell basis. The method combines a senescence-associated beta-galactosidase assay with staining of molecular markers for cellular senescence and of cellular identity. By utilizing technology that combines flow cytometry with high-content image analysis, we were able to quantify senescent cells in tumors, fibrotic tissues, and tissues of aged mice. Our approach also yielded the finding that senescent cells in tissues of aged mice are larger than nonsenescent cells. Thus, this method provides a basis for quantitative assessment of senescent cells and it offers proof of principle for combination of different markers of senescence. It paves the way for screening of senescent cells for identification of new senescence biomarkers, genes that bypass senescence or senolytic compounds that eliminate senescent cells, thus enabling a deeper understanding of the senescent state in vivo.

Keywords: ImageStreamX; aging; cancer; cellular senescence; flow cytometry; senescence-associated beta-galactosidase.


Figures

Figure 1
Figure 1
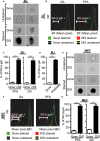
Identification and quantification of senescent cells in vitro. (A–G) Senescent and normally growing human BJ fibroblasts were stained for SA‐β‐gal or unstained and were analyzed by ImageStreamX. Bar, 10 μm. (A) Representative images of etoposide‐treated senescent BJ cells (DIS) and growing control cells after paraformaldehyde (PFA) fixation. (B) Bright‐field (BF) mean pixel intensity distribution of BJ cells after fixation with PFA or glutaraldehyde (GA). (C) Quantification of positive BJ cells as gated in (B). Data are presented as means ± SEM: for PFA, 6, performed in more than three independent experiments; for GA,= 4, performed in two independent experiments. ***< 0.001 (Student's t‐test). (D) Quantification of positive BJ cells that were irradiated to induce senescence, compared with growing cells; = 4, performed in two independent experiments. ***< 0.001. (E) Representative images of DIS mouse embryonic fibroblasts (MEFs) and control cells after PFA fixation. (F) BF mean pixel intensity distribution of MEFs after fixation with PFA or GA. (G) Quantification of positive primary MEFs as gated in (F). NF = Normalized frequencies. Values are means ± SEM; = 4, performed in two independent experiments; ***< 0.001(Student's t‐test).
Figure 2
Figure 2
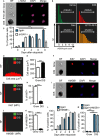
Identification of senescent cells via the combination of staining for SA‐β‐gal and molecular characteristics of senescence. (A–E) BJ cells treated with etoposide for 48 h, were harvested at the indicated times, stained for SA‐β‐gal, γH2AX (green), and DAPI (blue) and were analyzed by ImageStreamX. Control growing cells were considered time 0, cells immediately after the 48‐h treatment were considered day 2 and cells 8 days post etoposide treatment were considered as DIS. (A) Representative images of the cells stained as described above. Bar, 10 μm. (B) Distribution of numbers of γH2AX foci in these cells. DIS cells stained with the secondary antibodies only and DAPI served as a negative control (Sec). (C) Quantification of γH2AX‐positive and SA‐β‐gal‐positive BJ cells, as gated in (B), at different time points following initiation of etoposide treatment. (D) Representative histogram shows cell area distribution of DIS and growing BJ cells. (E) Quantification of cell area. (F–M) Growing and senescent BJ cells were stained for DAPI (blue) and Ki67 or HMGB1 (red) and were analyzed by ImageStreamX. Bar, 10 μm. (F) Representative images of the cells stained for Ki67. (G) Representative histogram presents max pixel intensity of Ki67 in DIS and growing BJ cells. (H) Quantification of Ki67‐positive BJ cells. (I) Representative images of cells stained for HMGB1. (J) Representative histogram showing mean pixel intensity of HMGB1 in DIS and growing BJ cells. (K) Quantification of HMGB1‐positive BJ cells. (L) Quantification of HMGB1‐negative and SA‐β‐gal‐positive BJ cells. n ≥ 3 (M) Quantification of the overlap between SA‐β‐gal staining and HMGB1‐negative staining. (A–C) Values are means ± SEM, n = 4 performed in two independent experiments. *< 0.05, ***< 0.001 (Student's t‐test). (E,H,K,M) Values are mean ± SEM,  5, and were replicated in two independent experiments. ***< 0.001 (Student's t‐test or two‐way ANOVA). NF = Normalized frequencies.
Figure 3
Figure 3
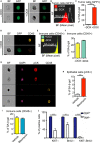
Identification and quantification of senescent cells in vivo. (A–F) MEF tumor cells expressing tetracycline transactivator protein tTA (‘tet‐off’), H‐rasV12, GFP, and TRE‐shp53 were injected subcutaneously into nude mice. Once tumors appeared, mice were treated with (+DOX) or without (−DOX) doxycycline. Tumors were extracted, dissociated, stained for SA‐β‐gal and CD45 (yellow), and analyzed by ImageStreamX. Bar, 10 μm. (A) Representative images of GFP‐positive tumor cells treated with or without DOX. (B) BF mean pixel intensity distribution of +DOX and −DOX tumor cells. (C) Quantification of positive tumor cells, as gated in (B). (D) Representative images of immune cells and tumor cells extracted from DOX‐treated mice. (E) BF mean pixel intensity distribution of immune cells extracted from DOX‐treated and untreated mice. (F) Quantification of positive immune cells, as gated in (E). (A–F) Data (= 5 mice) were replicated in two independent experiments. Values are mean ± SEM ***< 0.001 (Student's t‐test). NF = Normalized frequencies.(G–I) Lungs were extracted and dissociated from bleomycin‐treated and untreated mice. Cells were stained for SA‐β‐gal, CD45 (yellow), DAPI (blue), and Pan‐cytokeratin (PCK, red) and analyzed by ImageStreamX. (G) Representative images of the identified cells are shown. Bar, 10 μm. (H) Quantification of positive epithelial cells. (I) Quantification of positive immune cells. Data (= 4 mice) were replicated in two independent experiments. Values are means ± SEM, ***< 0.001 (Student's t‐test). (J) Quantification of Ki67‐ and BrdU‐negative cells within SA‐β‐gal‐positive and SA‐β‐gal‐negative lungs cells of bleomycin‐treated mice. n = 3, ***< 0.001, **< 0.01 (two‐way ANOVA).
Figure 4
Figure 4
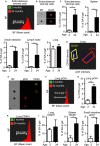
Identification and quantification of senescent cells in mouse tissues during aging. (A–I) Tissues extracted from 2‐ and 24‐month‐old mice were dissociated, stained for SA‐β‐gal and DAPI, and analyzed by ImageStreamX. Bar, 10 μm. (A) BF mean pixel intensity distribution of stromal cells derived from subcutaneous adipose tissue of 2‐ and 24‐month‐old mice. (B) Representative images of SA‐β‐gal‐positive and SA‐β‐gal‐negative subcutaneous adipose‐tissue‐derived stromal cells. (C) Quantification of SA‐β‐gal‐positive cells in the different tissues. (D) Tissues were stained for SA‐β‐gal, CD45, PCK, and DAPI. Immune cells were gated as CD45+ and epithelial cells as pCK+. (E) Representative images of CD45+ immune cells and PCK+ epithelial cells extracted from lungs. (F) BF mean pixel intensity distribution of PCK+ epithelial cells extracted from the lungs of 2‐ and 24‐month‐old mice. (G) Quantification of SA‐β‐gal‐positive PCK+ cells, as gated in (F). (H) BF mean pixel intensity distribution of CD45+ immune cells extracted from the lungs of 2‐ and 24‐month‐old mice. (I) Quantification of SA‐β‐gal‐positive lung CD45 +  cells as gated in (H). (A–I) NF = Normalized frequencies.Data (= 4 mice) were replicated in two independent experiments. Values are means ± SEM, *< 0.05 ***< 0.001 (Student's t‐test).
Figure 5
Figure 5
Lack of HMGB1 staining in SA‐β‐gal‐positive cells in mouse tissues. (A) Tissues extracted from 2‐ and 24‐month‐old mice were dissociated, stained for SA‐β‐gal, HMGB1, and DAPI, and analyzed by ImageStreamX. Quantification of the overlap between SA‐β‐gal‐positive staining and HMGB1‐negative staining in the different tissues. Data (= 3 mice) were replicated in two independent experiments. Values are mean ± SEM; *< 0.05 (two‐way ANOVA).
Figure 6
Figure 6
Increase in size of SA‐β‐gal‐positive cells in 24‐month‐old mice. (A) Cells from the different tissues were gated as SA‐β‐gal positive or SA‐β‐gal negative and their area was analyzed by ImageStreamX on BF images. Data (= 4 mice) were replicated in two independent experiments. Values are mean ± SEM; *< 0.05, **< 0.01, ***< 0.001 (Student's t‐test).

Similar articles

Cited by

References

    1. Aoshiba K, Tsuji T, Kameyama S, Itoh M, Semba S, Yamaguchi K, Nakamura H (2013) Senescence‐associated secretory phenotype in a mouse model of bleomycin‐induced lung injury. Exp. Toxicol. Pathol. 65, 1053–1062. - PubMed
    1. Baker DJ, Wijshake T, Tchkonia T, LeBrasseur NK, Childs BG, van de Sluis B, Kirkland JL, van Deursen JM (2011) Clearance of p16Ink4a‐positive senescent cells delays ageing‐associated disorders. Nature 479, 232–236. - PMC - PubMed
    1. Baker DJ, Childs BG, Durik M, Wijers ME, Sieben CJ, Zhong J, Saltness RA, Jeganathan KB, Verzosa GC, Pezeshki A, Khazaie K, Miller JD, van Deursen JM (2016) Naturally occurring p16(Ink4a)‐positive cells shorten healthy lifespan. Nature 530, 184–189. - PMC - PubMed
    1. Biran A, Perelmutter M, Gal H, Burton DG, Ovadya Y, Vadai E, Geiger T, Krizhanovsky V (2015) Senescent cells communicate via intercellular protein transfer. Genes Dev. 29, 791–802. - PMC - PubMed
    1. Burton DG, Krizhanovsky V (2014) Physiological and pathological consequences of cellular senescence. Cell. Mol. Life Sci. 71, 4373–4386. - PMC - PubMed

Publication types

MeSH terms