. 2017 May 16;8(20):32505-32522.
doi: 10.18632/oncotarget.17129.

Galectin-1 expression imprints a neurovascular phenotype in proliferative retinopathies and delineates responses to anti-VEGF

Affiliations

Galectin-1 expression imprints a neurovascular phenotype in proliferative retinopathies and delineates responses to anti-VEGF

Magali E Ridano et al. Oncotarget. .

Abstract

Neovascular retinopathies are leading causes of irreversible blindness. Although vascular endothelial growth factor (VEGF) inhibitors have been established as the mainstay of current treatment, clinical management of these diseases is still limited. As retinal impairment involves abnormal neovascularization and neuronal degeneration, we evaluated here the involvement of galectin-1 in vascular and non-vascular alterations associated with retinopathies, using the oxygen-induced retinopathy (OIR) model. Postnatal day 17 OIR mouse retinas showed the highest neovascular profile and exhibited neuro-glial injury as well as retinal functional loss, which persisted until P26 OIR. Concomitant to VEGF up-regulation, galectin-1 was highly expressed in P17 OIR retinas and it was mainly localized in neovascular tufts. In addition, OIR induced remodelling of cell surface glycophenotype leading to exposure of galectin-1-specific glycan epitopes. Whereas VEGF returned to baseline levels at P26, increased galectin-1 expression persisted until this time period. Remarkably, although anti-VEGF treatment in P17 OIR improved retinal vascularization, neither galectin-1 expression nor non-vascular and functional alterations were attenuated. However, this functional defect was partially prevented in galectin-1-deficient (Lgals1-/-) OIR mice, suggesting the importance of targeting both VEGF and galectin-1 as non-redundant independent pathways. Supporting the clinical relevance of these findings, we found increased levels of galectin-1 in aqueous humor from patients with proliferative diabetic retinopathy and neovascular glaucoma. Thus, using an OIR model and human samples, we identified a role for galectin-1 accompanying vascular and non-vascular retinal alterations in neovascular retinopathies.

Keywords: galectin-1; neovascularization; neurodegeneration; retinopathies; vascular endothelial growth factor.


Conflict of interest statement

CONFLICTS OF INTEREST

The authors declare that they have no conflict of interest.

Figures

Figure 1
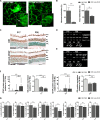
Figure 1. Neovascularization, neurodegeneration, glial activation and functional loss in OIR mouse retinas
A. Scheme representing the OIR mouse model with hallmark time points during experimental disease development. Neonatal mice and their nursing mother are kept in room air from birth to P7 and normal vascular development ensues. At P7, they are exposed to 75% oxygen, which inhibits retinal vessel growth and causes significant VO. Mice are returned to room air at P12; the avascular retina becomes hypoxic, eliciting both normal vessel regrowth and pathological neovascular response. NV reaches its maximum at P17. Shortly thereafter, it spontaneously regresses and the vascular alterations resolve by P25. This scheme is adapted from Connor KM et al. Nat Protoc. 2009;4:1565-1573. B. Representative images of whole mount retinas at P17 showing GSA-IB4 vascular staining in RA and OIR mice. Areas with VO and NV are indicated. Scale bar: 100 μm. C. Representative TUNEL cryosections labeling of RA and OIR mice, at P17 and P26. Scale bar: 50 μm. Abbreviations: GCL, ganglion cell layer; IPL, inner plexiform layer; INL, inner nuclear layer; OPL, outer plexiform layer; ONL, outer nuclear layer. Arrows are indicating TUNEL-positive nuclei. D. Quantification of the TUNEL-positive cells between both groups at P17 and P26 are shown. E. and F. Representative Western blot of total caspase-3, GFAP and GS from neural retinal extracts of RA and OIR mice at P12, P17 and P26. β-actin is shown as a loading control. G. Levels of GFAP and GS were quantified by densitometry and normalized by β-actin. Graph shows results from four independent experiments. H. Amplitudes and latencies of a- and b-waves from scotopic ERG were recorded at P17 and P26 in RA and OIR mice. Data show the average of responses over both eyes, in five mice per condition. Data are presented as mean ± SEM. ns, non-significant, *p < 0.05, **p < 0.01, *** p < 0.001.
Figure 2
Figure 2. Gal1 expression and localization in RA and OIR mouse retinas
A. Representative Western blot of Gal1 and VEGF from neural retina extracts of RA and OIR mice at P12, P17 and P26. β-actin is shown as a loading control. B. Levels of Gal1 and VEGF were quantified by densitometry and normalized by β-actin. Results of at least four independent experiments are shown. C. Gal1 mRNA was quantified by qRT-PCR in neurosensory retinas of P17 and P26 OIR mice or RA (control) conditions. Results were normalized to β-actin and expressed according to the 2−ΔΔCt method using as calibrator the mRNA level obtained from P17 RA mouse retinas. Data are presented as mean ± SEM. ns, non-significant, *p < 0.05, **p < 0.01, *** p < 0.001. D. Representative immunofluorescence analysis of Gal1 (green) in cryosections of RA and OIR mouse retinas at P12, P17 and P26 (first panel). Double labeling using a mouse monoclonal antibody for Gal1 (green) and an astrocyte and activated MGC marker, anti-GFAP (red) (second panel), or a MGC-specific marker, anti-GS (red) (third panel) and a rabbit polyclonal anti-Gal1 (red) in combination with an endothelial cell marker, anti-CD31 (green) (fourth panel). Cell nuclei were counterstained with Hoechst 33258 (blue). Scale bar: 25 μm. E. High magnification confocal micrograph of the representative P17 RA and OIR retinas showing a typical vessel (left panel) and a neovascular tuft (right panel). Images were taken with silicon 60X objective in the best confocal resolution condition and spatial deconvolution was done with the Huygeng Professional software. X, Y and Z reconstruction images (left) and a representative image with a line indicating the zone of Z profile (right) are shown. Yellow arrowheads indicate Gal1 distribution in RA and in OIR endothelial cells. Abbreviations: ILM, inner limiting membrane; GCL, ganglion cell layer; IPL, inner plexiform layer; INL, inner nuclear layer; OPL, outer plexiform layer; ONL, outer nuclear layer; NV, neovascularization; GC: ganglion cell.
Figure 3
Figure 3. Glycosylation profile of RA and OIR mouse retinas
Representative staining of LEL A., L-PHA B. and SNA C. in red (upper panel) and its combination with anti-Gal1 in green (bottom panel) in cryosections of P12, P17 and P26 RA and OIR retinas. Cell nuclei were counterstained with Hoechst 33258 (blue). Arrows indicate areas of colocalization in neovessels (yellow). All the experiments were performed in triplicate and are representative of three independent experiments. Abbreviations: ILM, inner limiting membrane; GCL, ganglion cell layer; IPL, inner plexiform layer; INL, inner nuclear layer; OPL, outer plexiform layer; ONL, outer nuclear layer; NV, neovascularization. Scale bar: 25 μm.
Figure 4
Figure 4. Impact of anti-VEGF treatment in the OIR mouse model
A. Representative images of whole mount retinas at P17 OIR showing GSA-IB4 vascular staining in PBS (control) or anti-VEGF-injected eyes. Areas with VO and NV are indicated. Scale bar: 100 μm. B. The VO (%) was quantified as the ratio of central avascular area to whole retinal area and the NV (%) was quantified as a percentage of whole retinal area. Data are presented as mean ± SEM. **p < 0.01, *** p < 0.001. C. Representative TUNEL-labeled cryosections of OIR mice injected or not with anti-VEGF at P17 and P26. Scale bar: 50 μm. D. and E. Representative Western blot of total caspase-3, GFAP and GS from neural retina extracts of RA and OIR mice injected or not with anti-VEGF mAb at P17 and P26. β-actin is shown as a loading control. F. Levels of GFAP and GS were quantified by densitometry and normalized to β-actin. Graph shows results of four independent experiments. G. Amplitudes and latencies of a- and b-waves from scotopic ERG were recorded at P17 and P26 in OIR mice injected or not with anti-VEGF mAb. Data show the average of responses in both eyes with five mice per condition. Data are presented as mean ± SEM or as median and interquartile range according to parametric or not parametric test used for analysis. ns, non-significant, *p < 0.05, **p < 0.01, *** p < 0.001.
Figure 5
Figure 5. Gal1 expression and function as well as the glycophenotype of mouse OIR retinas after anti-VEGF therapy
A. Representative Western blot of Gal1 and VEGF from P17 neural retinal extracts of RA and OIR mice injected or not with anti-VEGF mAb. β-actin is shown as a loading control. B. Levels of Gal1 and VEGF were quantified by densitometry and normalized to β-actin. Graph shows results of three independent experiments. C. Gal1 mRNA levels were quantified by qRT-PCR in neurosensory retinas of P17 OIR mice, injected or not with anti-VEGF mAb, and RA (control) conditions. Results were normalized to β-actin and expressed according to the 2−ΔΔCt method using as calibrator the mRNA level obtained from P17 RA mouse retinas. Data are presented as mean ± SEM or as median and interquartile range according to parametric or not parametric test used for analysis. ns, non-significant, *p < 0.05, **p < 0.01, *** p < 0.001. D. Representative immunofluorescence analysis of Gal1 (green) or in combination with LEL (red, second panel), L-PHA (red, third panel) or SNA (red, bottom panel), in cryosections of P17 OIR mice injected or not with anti-VEGF. Abbreviations: ILM, inner limiting membrane; GCL, ganglion cell layer; IPL, inner plexiform layer; INL, inner nuclear layer; OPL, outer plexiform layer; ONL, outer nuclear layer; NV, neovascularization. Scale bar: 25 μm. E. Amplitudes and latencies of a- and b-waves from scotopic ERG were recorded at P17 and P26 in OIR and Lgals1−/− mice. Data show the average of responses in both eyes with three mice per condition. Data are presented as mean ± SEM or as median and interquartile range according to parametric or not parametric test used for analysis. ns, non-significant, *p < 0.05, **p < 0.01, *** p < 0.001.
Figure 6
Figure 6. Relevance of Gal1 in human proliferative retinopathies of diabetic patients
Representative graph of Gal1 levels in the aqueous humor of control and diabetes mellitus patients with proliferative diabetic retinopathy or neovascular glaucoma. Data are presented as median and interquartile range. ns, non-significant, *p < 0.05, *** p < 0.001.

References

    1. Friedlander M, Dorrell MI, Ritter MR, Marchetti V, Moreno SK, El-Kalay M, Bird AC, Banin E, Aguilar E. Progenitor cells and retinal angiogenesis. Angiogenesis. 2007;10:89–101. doi: 10.1007/s10456-007-9070-4. - DOI - PubMed
    1. Wells JA, Glassman AR, Ayala AR, Jampol LM, Aiello LP, Antoszyk AN, Arnold-Bush B, Baker CW, Bressler NM, Browning DJ, Elman MJ, Ferris FL, Friedman SM, et al. Aflibercept, bevacizumab, or ranibizumab for diabetic macular edema. N Engl J Med. 2015;372:1193–203. doi: 10.1056/NEJMoa1414264. - DOI - PMC - PubMed
    1. Durham JT, Herman IM. Microvascular modifications in diabetic retinopathy. Curr Diab Rep. 2011;11:253–64. doi: 10.1007/s11892-011-0204-0. - DOI - PubMed
    1. Aiello LP. Vascular endothelial growth factor and the eye: biochemical mechanisms of action and implications for novel therapies. Ophthalmic Res. 1997;29:354–62. doi: 10.1159/000268033. - DOI - PubMed
    1. Das A, McGuire PG. Retinal and choroidal angiogenesis: pathophysiology and strategies for inhibition. Prog Retin Eye Res. 2003;22:721–48. doi: 10.1016/j.preteyeres.2003.08.001. - DOI - PubMed

Substances