. 2017 Sep:81:12-32.
doi: 10.1016/j.artmed.2017.03.003. Epub 2017 Apr 27.

Inter-labeler and intra-labeler variability of condition severity classification models using active and passive learning methods

Affiliations

Inter-labeler and intra-labeler variability of condition severity classification models using active and passive learning methods

Nir Nissim et al. Artif Intell Med. 2017 Sep.

Abstract

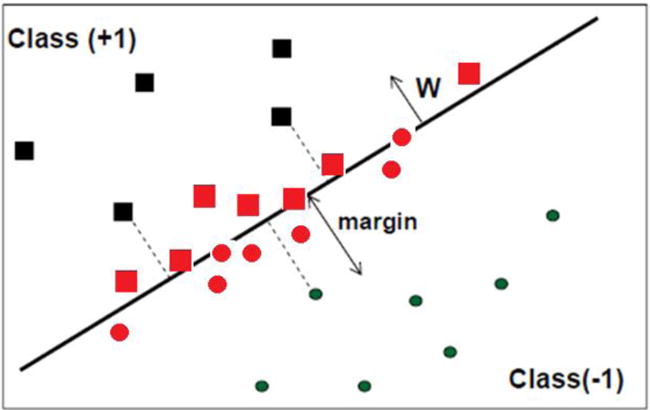
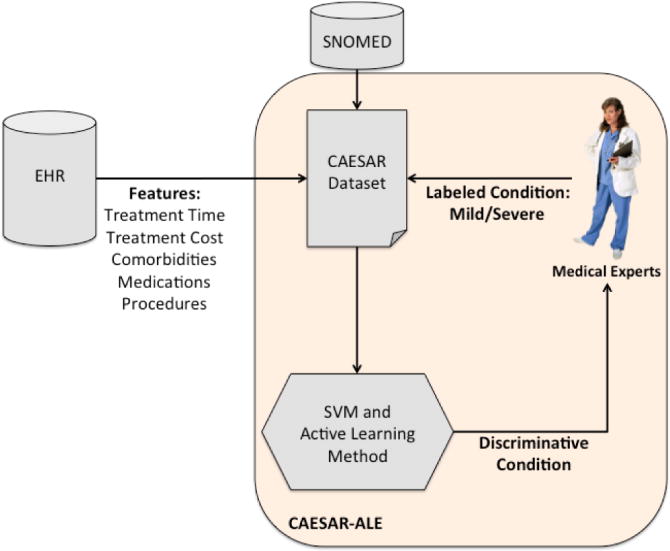
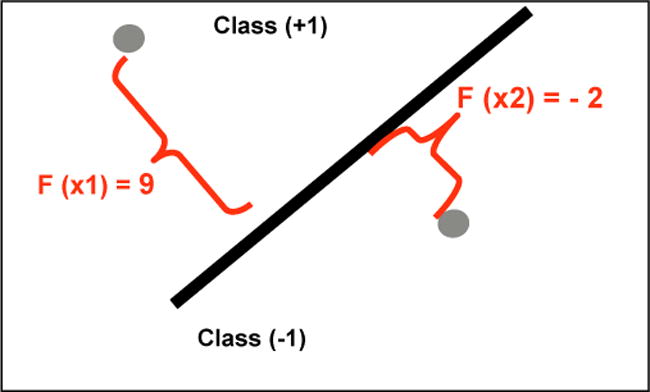
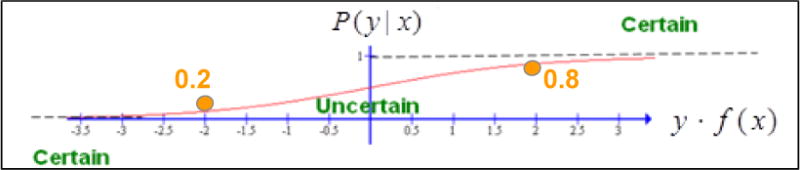
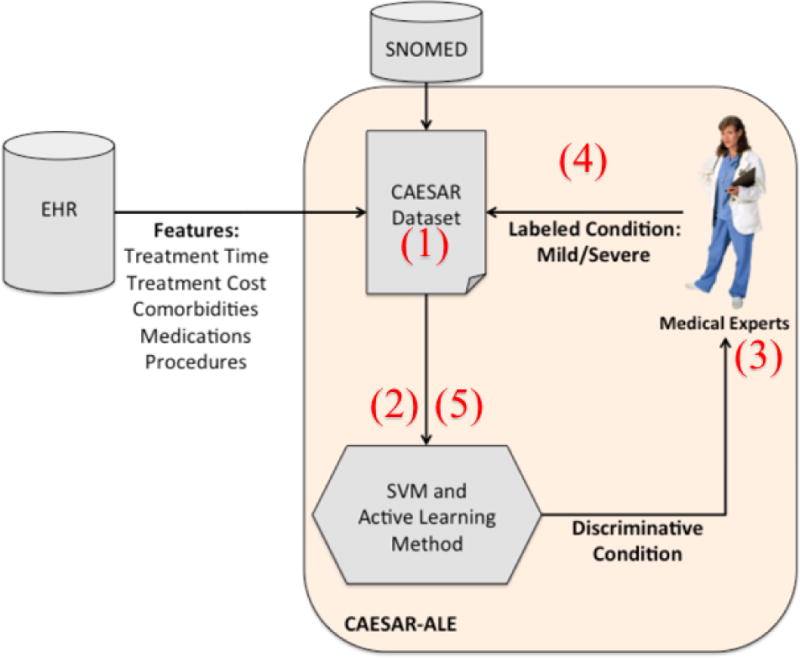
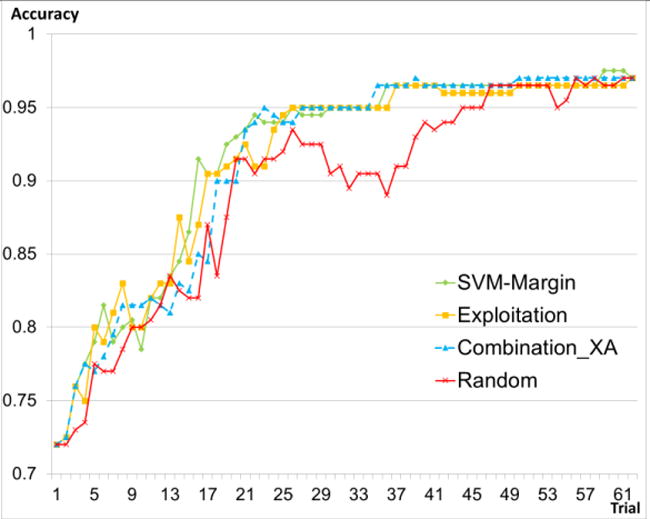
Background and objectives: Labeling instances by domain experts for classification is often time consuming and expensive. To reduce such labeling efforts, we had proposed the application of active learning (AL) methods, introduced our CAESAR-ALE framework for classifying the severity of clinical conditions, and shown its significant reduction of labeling efforts. The use of any of three AL methods (one well known [SVM-Margin], and two that we introduced [Exploitation and Combination_XA]) significantly reduced (by 48% to 64%) condition labeling efforts, compared to standard passive (random instance-selection) SVM learning. Furthermore, our new AL methods achieved maximal accuracy using 12% fewer labeled cases than the SVM-Margin AL method. However, because labelers have varying levels of expertise, a major issue associated with learning methods, and AL methods in particular, is how to best to use the labeling provided by a committee of labelers. First, we wanted to know, based on the labelers' learning curves, whether using AL methods (versus standard passive learning methods) has an effect on the Intra-labeler variability (within the learning curve of each labeler) and inter-labeler variability (among the learning curves of different labelers). Then, we wanted to examine the effect of learning (either passively or actively) from the labels created by the majority consensus of a group of labelers.

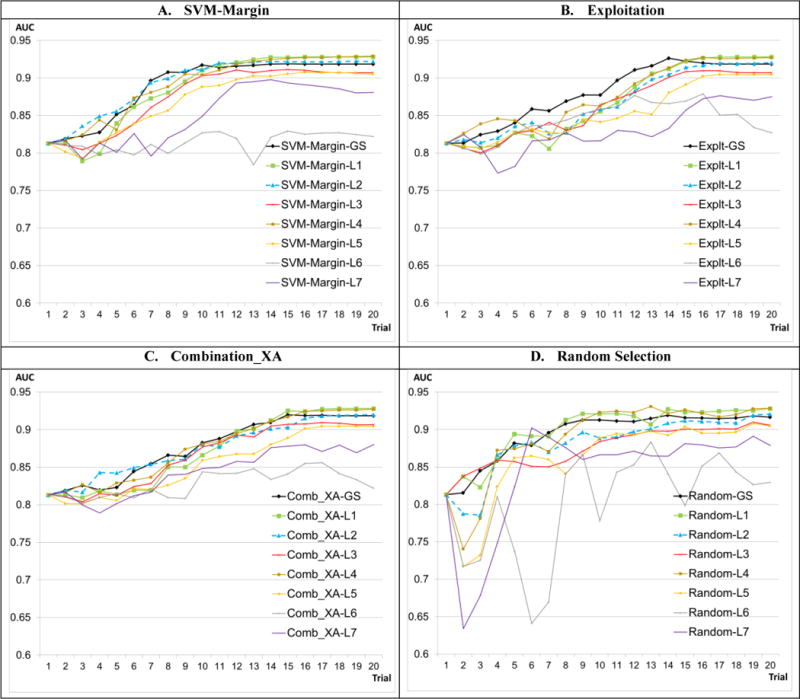
Methods: We used our CAESAR-ALE framework for classifying the severity of clinical conditions, the three AL methods and the passive learning method, as mentioned above, to induce the classifications models. We used a dataset of 516 clinical conditions and their severity labeling, represented by features aggregated from the medical records of 1.9 million patients treated at Columbia University Medical Center. We analyzed the variance of the classification performance within (intra-labeler), and especially among (inter-labeler) the classification models that were induced by using the labels provided by seven labelers. We also compared the performance of the passive and active learning models when using the consensus label.

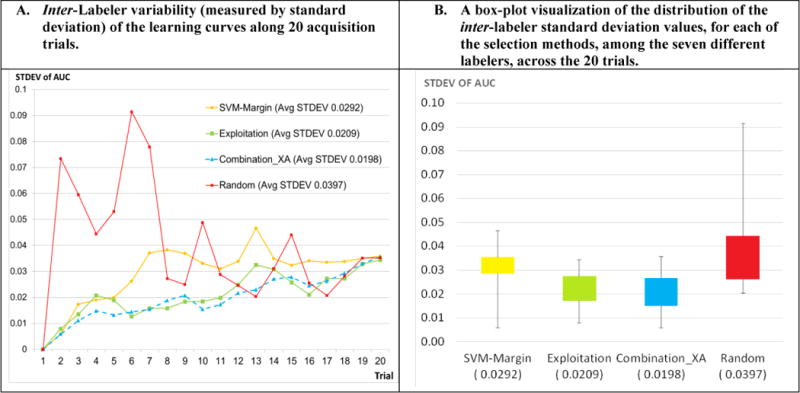
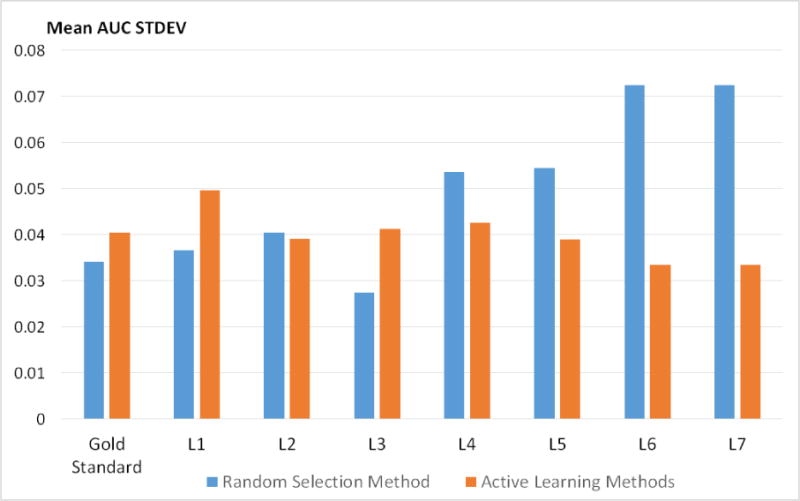
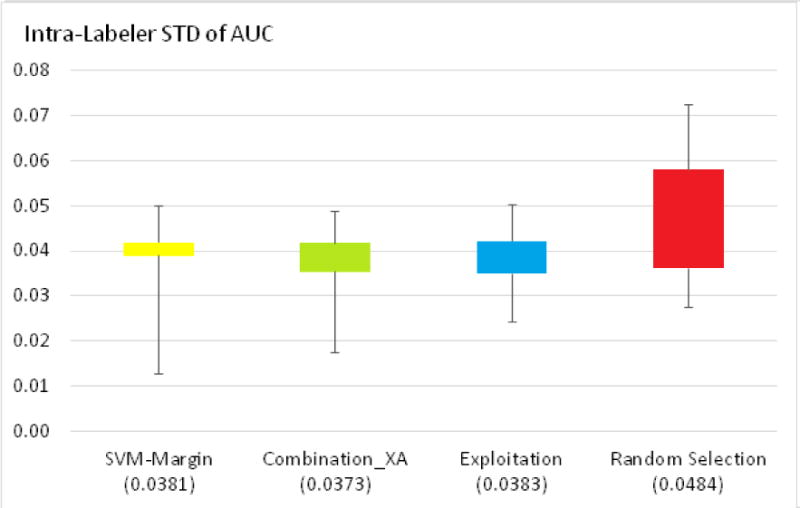
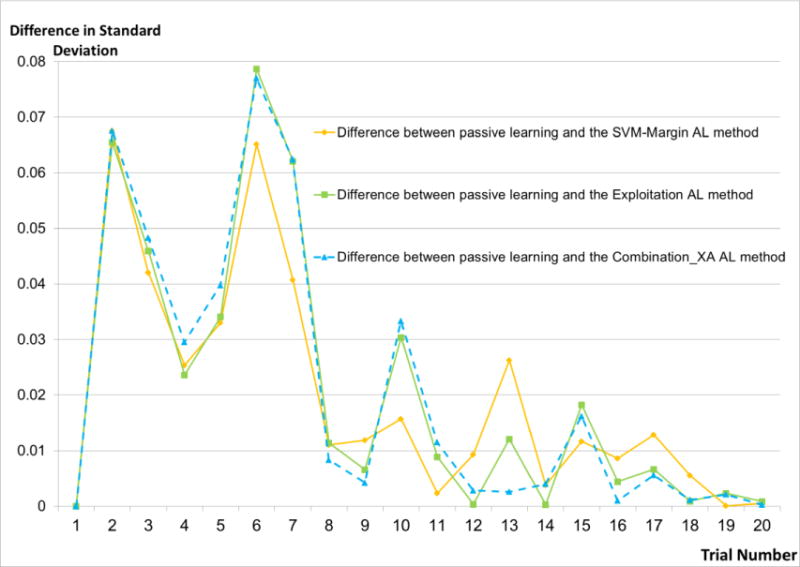
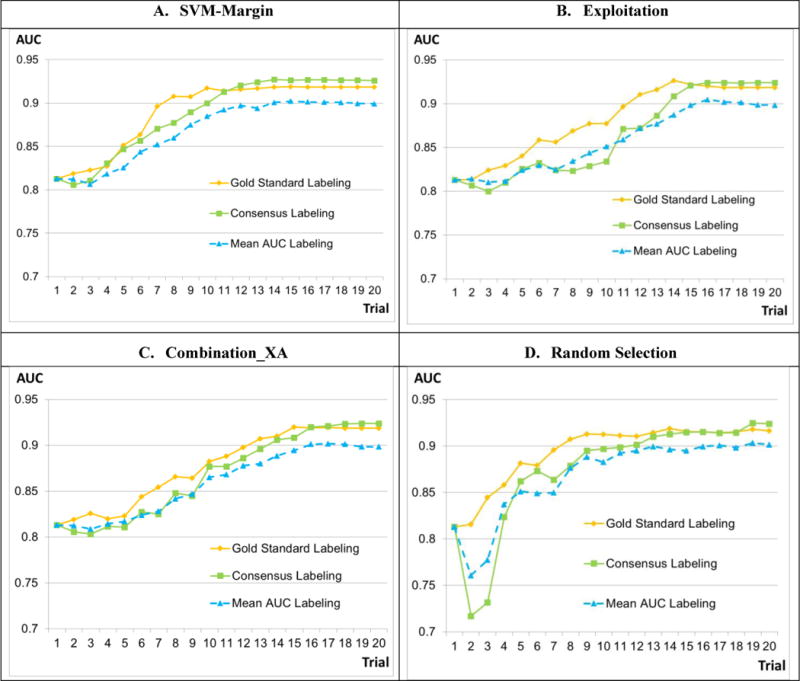
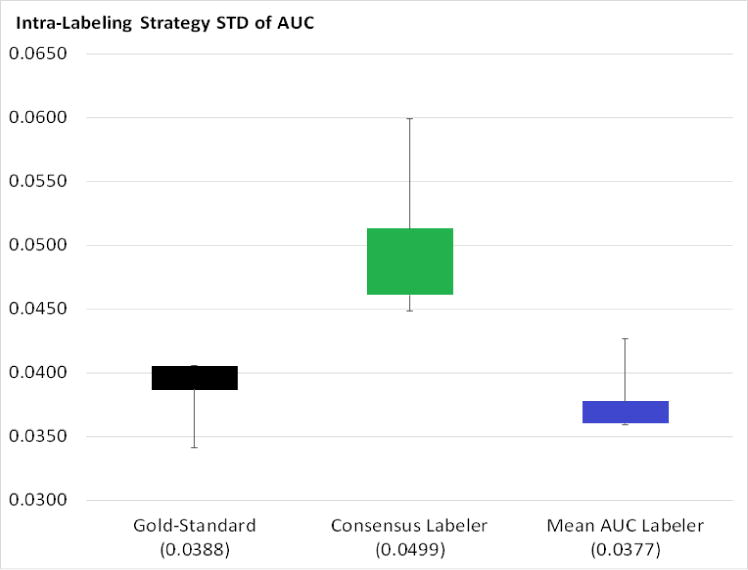
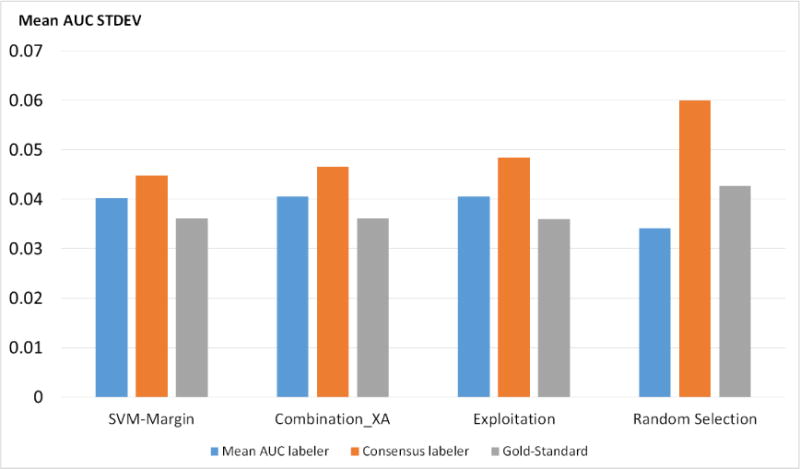
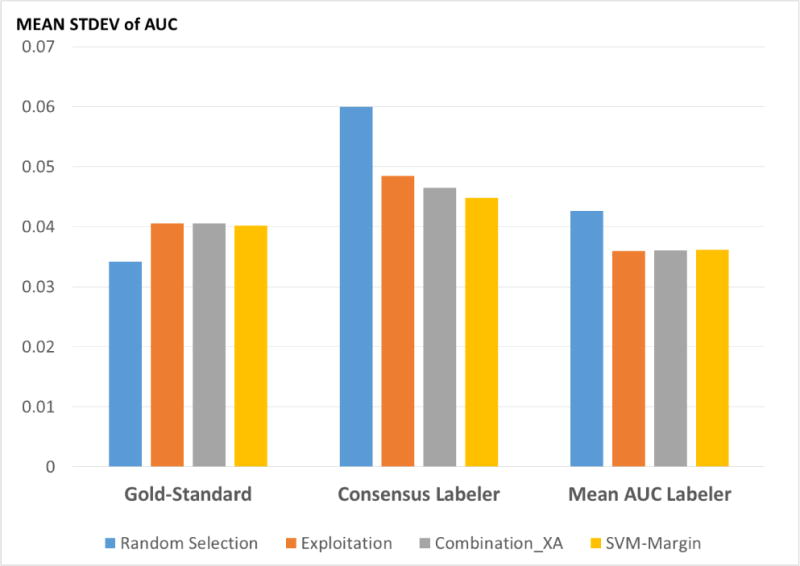
Results: The AL methods: produced, for the models induced from each labeler, smoother Intra-labeler learning curves during the training phase, compared to the models produced when using the passive learning method. The mean standard deviation of the learning curves of the three AL methods over all labelers (mean: 0.0379; range: [0.0182 to 0.0496]), was significantly lower (p=0.049) than the Intra-labeler standard deviation when using the passive learning method (mean: 0.0484; range: [0.0275-0.0724). Using the AL methods resulted in a lower mean Inter-labeler AUC standard deviation among the AUC values of the labelers' different models during the training phase, compared to the variance of the induced models' AUC values when using passive learning. The Inter-labeler AUC standard deviation, using the passive learning method (0.039), was almost twice as high as the Inter-labeler standard deviation using our two new AL methods (0.02 and 0.019, respectively). The SVM-Margin AL method resulted in an Inter-labeler standard deviation (0.029) that was higher by almost 50% than that of our two AL methods The difference in the inter-labeler standard deviation between the passive learning method and the SVM-Margin learning method was significant (p=0.042). The difference between the SVM-Margin and Exploitation method was insignificant (p=0.29), as was the difference between the Combination_XA and Exploitation methods (p=0.67). Finally, using the consensus label led to a learning curve that had a higher mean intra-labeler variance, but resulted eventually in an AUC that was at least as high as the AUC achieved using the gold standard label and that was always higher than the expected mean AUC of a randomly selected labeler, regardless of the choice of learning method (including a passive learning method). Using a paired t-test, the difference between the intra-labeler AUC standard deviation when using the consensus label, versus that value when using the other two labeling strategies, was significant only when using the passive learning method (p=0.014), but not when using any of the three AL methods.

Conclusions: The use of AL methods, (a) reduces intra-labeler variability in the performance of the induced models during the training phase, and thus reduces the risk of halting the process at a local minimum that is significantly different in performance from the rest of the learned models; and (b) reduces Inter-labeler performance variance, and thus reduces the dependence on the use of a particular labeler. In addition, the use of a consensus label, agreed upon by a rather uneven group of labelers, might be at least as good as using the gold standard labeler, who might not be available, and certainly better than randomly selecting one of the group's individual labelers. Finally, using the AL methods: when provided by the consensus label reduced the intra-labeler AUC variance during the learning phase, compared to using passive learning.

Keywords: Active learning; Condition; Electronic health records; Labeling; Phenotyping; Severity; Variance.


Figures

Figure 1
Figure 1
An SVM with a maximal margin which separates the training set into two classes in a two-dimensional space (two features).
Figure 2
Figure 2
The examples (colored in red) that will be selected according to the SVM-Margin AL method’s criteria.
Figure 3
Figure 3
The process of using AL methods to detect discriminative conditions requiring medical expert labeling.
Figure 4
Figure 4
Decision values given to two examples.
Figure 5
Figure 5
Analysis of Equation 7 - the larger the distance the example is from the separating hyperplane, the higher the probability and the more confidence of the classifier.
Figure 6.1
Figure 6.1
An illustration showing the Exploitation method’s criteria for acquiring new severe conditions.
Figure 6.2
Figure 6.2
The process and steps (–5) of CAESAR-ALE - using AL methods to detect discriminative conditions requiring medical expert labeling.
Figure 7
Figure 7
The accuracy of the CAESAR-ALE models induced using the two new active learning methods versus the models induced using the SVM-Margin and the passive (Random selection) method, over 62 trials (five conditions acquired during each trial).
Figure 8
Figure 8
TPR for active learning and random selection methods over 62 trials.
Figure 9
Figure 9
The accumulated number of severe conditions acquired in the training set by each AL method over 62 trials.
Figure 10
Figure 10
The learning curves of the three active learning methods and of the passive (Random selection) learning method, by using the labels provided by the labelers and the gold standard (GS) label.
Figure 11
Figure 11
Inter-labeler variability of the four learning methods. The standard deviation among the seven models induced by each of the seven labelers after each data acquisition trial is plotted across the 20 acquisition trials, for each of the four learning methods (11-A). A box-plot visualization displays the distribution of the standard deviation values, among the seven labelers, over the 20 acquisition trials for these methods (11-B). Each box’s lower and upper boundaries denote the 25th and 75th percentiles; the whiskers denote the absolute minimal and maximal values. The mean Inter-labeler standard deviation value across the 20 trials, for each of the four methods, appears in parentheses below the name of each of the methods shown in the box-plot visualization.
Figure 12-A
Figure 12-A
The learning curves, measured as the area under the curve (AUC) values, of the models induced from the labels provided by each of the seven labelers and gold standard label, for each selection method (three AL methods and the passive [Random selection] method) and the Intra-labelers’ variance, represented by the mean standard deviation of the models induced from every labeler across each of the four selection methods, over his/her performance during the acquisition phase.
Figure 12-B
Figure 12-B
The mean intra-labeler variance, for the 20 acquisition trials, in the performance of the models induced from the labels provided by each labeler, for the seven labelers and the gold standard label. For each labeler (and for the gold standard label), the mean variance over time of the models induced using the passive learning method is compared to the mean variance of all of the models induced over time using the three active learning methods.
Figure 12-C
Figure 12-C
The intra-labeler variance of the models induced using each of the three active learning methods and the passive (Random selection) method, across the models induced from the labels provided by the seven labelers and from the gold standard label. The mean values of the standard deviation, across all labelers, appear in parentheses under each method.
Figure 12-D
Figure 12-D
The distribution of the Intra-labeler variance of the models induced using all of the three active learning methods, compared to the Intra-labeler variance of the models induced using the passive (Random selection) method, across the models induced from the labels provided by the seven labelers and from the gold standard label. The mean values of the standard deviation, across all labelers and learning methods, appear in parentheses under each method type.
Figure 13
Figure 13
The difference in standard deviation (absolute value) of the AUC among the classifiers induced by the AL methods and the passive (Random selection) learning method.
Figure 14
Figure 14
The learning curves of the models induced by using the three AL methods and the passive (Random selection) learning method, for the three different labeling setups: gold standard labeler, consensus (majority) labeler, and mean AUC of the seven labelers, representing a randomly selected labeler.
Figure 15
Figure 15
The learning curves of the models induced from the labels provided by the three different labeling setups: gold standard labeler, consensus (majority) labeler, and mean AUC of the seven labelers, for each of the selection methods: the passive (Random selection) learning method and the three AL methods.
Figure 16-A
Figure 16-A
A [25th, 75th percentile] box-plot of the mean Intra-labeler standard deviation of the AUC, and its minimal and maximal ranges, for the four learning methods, during the training phase, for the three labeling strategies. The mean values of the standard deviation, appear in parentheses under each method type.
Figure 16-B
Figure 16-B
The mean Intra-labeler standard deviation of the AUC, comparing, for each of the four selection methods, the three labeling strategies
Figure 16-C
Figure 16-C
A comparison of the mean standard deviation of the AUC among the four leaning methods, for each of the three labeling strategies.

References

    1. Stang PE, Ryan PB, Racoosin JA, et al. Advancing the science for active surveillance: rationale and design for the Observational Medical Outcomes Partnership. Ann Intern Med. 2010 Nov 2;153(9):600–6. - PubMed
    1. Kho AN, Pacheco JA, Peissig PL, et al. Electronic medical records for genetic research: results of the eMERGE consortium. Science translational medicine. 2011 Apr 20;3(79):79re1. - PMC - PubMed
    1. Denny JC, Ritchie MD, Basford MA, et al. PheWAS: demonstrating the feasibility of a phenome-wide scan to discover gene–disease associations. Bioinformatics. 2010 May 1;26(9):1205–10. - PMC - PubMed
    1. Boland MR, Hripcsak G, Shen Y, Chung WK, Weng C. Defining a comprehensive verotype using electronic health records for personalized medicine. J Am Med Inform Assoc. 2013 Dec 1;20(e2):e232–e8. - PMC - PubMed
    1. Weiskopf NG, Weng C. Methods and dimensions of electronic health record data quality assessment: enabling reuse for clinical research. J Am Med Inform Assoc. 2013;20(1):144–51. - PMC - PubMed

LinkOut - more resources