Review
. 2017 Jun;16(6):959-981.
doi: 10.1074/mcp.MR117.000024. Epub 2017 Apr 29.

Methods, Tools and Current Perspectives in Proteogenomics

Affiliations
Review

Methods, Tools and Current Perspectives in Proteogenomics

Kelly V Ruggles et al. Mol Cell Proteomics. 2017 Jun.

Abstract

With combined technological advancements in high-throughput next-generation sequencing and deep mass spectrometry-based proteomics, proteogenomics, i.e. the integrative analysis of proteomic and genomic data, has emerged as a new research field. Early efforts in the field were focused on improving protein identification using sample-specific genomic and transcriptomic sequencing data. More recently, integrative analysis of quantitative measurements from genomic and proteomic studies have identified novel insights into gene expression regulation, cell signaling, and disease. Many methods and tools have been developed or adapted to enable an array of integrative proteogenomic approaches and in this article, we systematically classify published methods and tools into four major categories, (1) Sequence-centric proteogenomics; (2) Analysis of proteogenomic relationships; (3) Integrative modeling of proteogenomic data; and (4) Data sharing and visualization. We provide a comprehensive review of methods and available tools in each category and highlight their typical applications.


Conflict of interest statement

The content is solely the responsibility of the authors and does not necessarily represent the official views of the National Institutes of Health

Figures
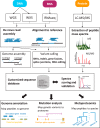
Fig. 1.
Fig. 1.
Sequence-centric proteogenomics. Sequencing-based technologies to sequence DNA (whole genome sequencing, WGS; whole exome sequencing, WXS) and RNA (RNA-seq) generate millions of short sequencing reads that are assembled into genomes, exomes or transcriptomes by either de novo or template-based approaches by alignment to a reference sequence. Sample-specific sequence aberrations are determined and nucleotide sequences are transformed into personalized, amino acid-centric sequence databases. Peptide mass spectra derived by LC-MS/MS analysis from a matching sample are then scored and validated against the personalized database enabling the detection of sample-specific peptide sequences. Depending on the scope of the proteogenomic project, these peptides can then be used to (1) aid genome annotation by detection of peptides in unannotated genome regions; (2) identify tumor-specific mutations translated into the proteome as well as novel protein splice variants; and (3) detect species-specific peptides in microbial communities.
Fig. 2.
Fig. 2.
Proteogenomic relationships. A, Correlation analysis of mRNA and protein pairs across samples enables the assessment of global correlation structure which typically centers between correlation coefficients of 0.3 and 0.5. B, Regulatory effects on RNA and protein expression levels caused by copy number aberrations (CNA), genetic variants (eQTL) and microRNAs (miRNAs) can be studied by different correlation-based approaches. CNA cis and trans effects on RNA, protein and PTM expression can be determined by correlating each gene copy number at a given locus to all quantified features in RNA, protein or PTM space across all samples. Expression quantitative trait loci (eQTL) analysis can be used to identify DNA sequence variants affecting RNA/protein expression levels in the sample population being studied. Global miRNA analysis accompanied with mRNA or protein profiling enables the assessment of miRNA mediated regulation of mRNA and protein expression. C, Integrative analysis of genetic variants and PTM sites like phosphorylation can identify functional consequences of genetic variants at the molecular level. Mutations that directly affect serine, threonine and tyrosine residues can result in destruction or genesis of phosphosites (I); mutations adjacent to phosphosites can result in removal or addition of phosphosites (II) or change the kinase that recognizes the phosphorylation site (III).
Fig. 3.
Fig. 3.
Integrative modeling. Overview of sub-topics in integrative modeling of proteogenomic data. A, Clustering techniques illustrating a schematic of multi-omic hierarchical clustering analysis resulting in the identification of two subtypes, B, Predictive modeling for disease diagnosis, prognosis, drug response and drug toxicity using multiple data modalities and, C, proteogenomic pathway and network modeling, including informing network composition and pathway and GO term enrichment.
Fig. 4.
Fig. 4.
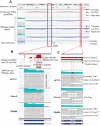
Genome-based visualization, using proBAM as an example. proBAM is a data format to integrate mass spectrometry data with the genome. In this example, we show the visualization of 10 colorectal cancer cell lines in proBAM format. The PSMs result from a search against a customized database built from matched RNA-Seq data, which are also incorporated into the visualization. A, Integrative Genomics Viewer (IGV) snapshot visualizes peptides and RNA-Seq reads mapped to KRAS in one window. The upper panel shows proteomic data from 10 colon cancer cell lines indicated by different colors. The bottom three panels illustrate RNA-Seq data from cell lines HCT15, Caco-2 and SW480, respectively. B, Zoomed-in view of an exon region in KRAS. Similar to RNA-Seq reads (three bottom panels), peptides mapped to the genome can be classified into within exon peptides and junction peptides in the proBAM file (upper panel). C, The upper panel shows a zoomed-in view of mutations confirmed by both RNA-Seq and proteomic data in KRAS. A G13D mutation in HCT15 and a G12V mutation in SW480 are observed in both transcriptomic (second and fourth panel) and proteomics (first panel) data, whereas wild type peptide is observed in Caco-2 (third panel).
Fig. 5.
Fig. 5.
NetGestalt-based analysis of colorectal cancer proteomics data. A, NetGestalt created a one-dimensional (1-D), linear order of all 12,112 genes in a protein-protein interaction network based on the hierarchical modular organization of the network. The ruler indicates coordinates of the genes in the resulting linear order. B, Each bar represents a module identified from the network and alternating bar colors (green and orange) are used to distinguish neighboring modules. C, Colorectal cancer proteomics data visualized as a heat map with each row representing a sample. Red and blue colors in the heat map represent relative over- and under-expression, respectively. All 12,112 genes in the network are visualized in the heat map, and missing values in the proteomic data are indicated in gray color. The samples (rows) of the data are ordered based on the five subtypes visualized beside the heat map. D, Signed minus log10 transformed p values of the difference between subtype 3 and other subtypes visualized by the bar plot. Missing values are indicated by yellow bars in the bar plot. E, Significantly over-expressed genes in subtype 3 (FDR<0.05). F–H, Zoomed-in view of a region corresponding to one of the over-represented modules. I, Genes in (H) visualized in a node-link diagram. The edges in the diagram represent protein-protein interactions.

References

    1. Jaffe J. D., Berg H. C., and Church G. M. (2004) Proteogenomic mapping as a complementary method to perform genome annotation. Proteomics 4, 59–77 - PubMed
    1. Liu Y., Beyer A., and Aebersold R. (2016) On the dependency of cellular protein levels on mRNA abundance. Cell 165, 535–550 - PubMed
    1. Vogel C., and Marcotte E. M. (2012) Insights into the regulation of protein abundance from proteomic and transcriptomic analyses. Nat. Rev. Genet. 10.1038/nrg3185 - DOI - PMC - PubMed
    1. Battle A., Khan Z., Wang S. H., Mitrano A., Ford M. J., Pritchard J. K., and Gilad Y. (2015) Genomic variation. Impact of regulatory variation from RNA to protein. Science 347, 664–667 - PMC - PubMed
    1. Foss E. J., Radulovic D., Shaffer S. A., Goodlett D. R., Kruglyak L., and Bedalov A. (2011) Genetic variation shapes protein networks mainly through non-transcriptional mechanisms. PLos Biol. 9, e1001144. - PMC - PubMed

Publication types

LinkOut - more resources