. 2017 May 1;5(1):49.
doi: 10.1186/s40168-017-0260-z.

Differences in gut microbial composition correlate with regional brain volumes in irritable bowel syndrome

Affiliations

Differences in gut microbial composition correlate with regional brain volumes in irritable bowel syndrome

Jennifer S Labus et al. Microbiome. .

Abstract

Background: Preclinical and clinical evidence supports the concept of bidirectional brain-gut microbiome interactions. We aimed to determine if subgroups of irritable bowel syndrome (IBS) subjects can be identified based on differences in gut microbial composition, and if there are correlations between gut microbial measures and structural brain signatures in IBS.

Methods: Behavioral measures, stool samples, and structural brain images were collected from 29 adult IBS and 23 healthy control subjects (HCs). 16S ribosomal RNA (rRNA) gene sequencing was used to profile stool microbial communities, and various multivariate analysis approaches were used to quantitate microbial composition, abundance, and diversity. The metagenomic content of samples was inferred from 16S rRNA gene sequence data using Phylogenetic Investigation of Communities by Reconstruction of Unobserved States (PICRUSt). T1-weighted brain images were acquired on a Siemens Allegra 3T scanner, and morphological measures were computed for 165 brain regions.

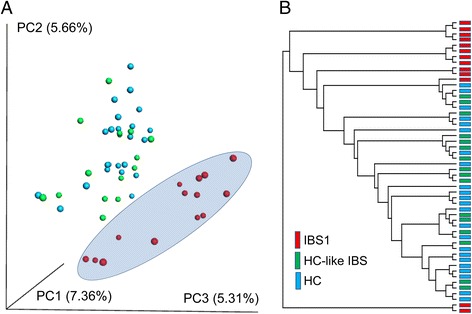
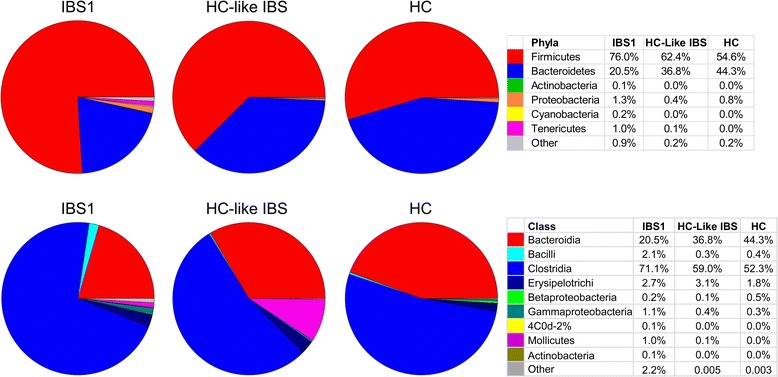
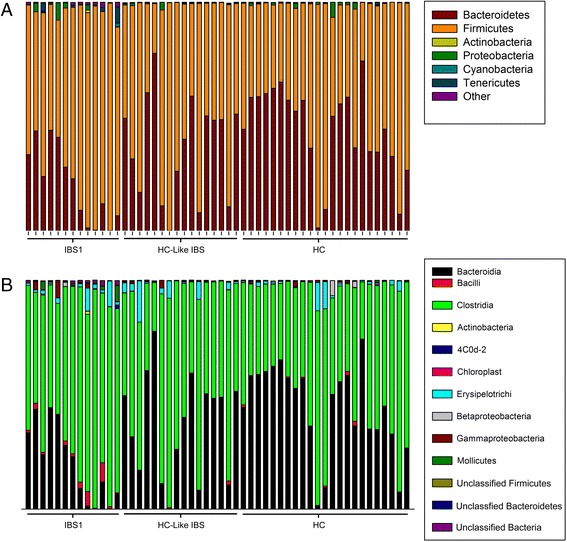
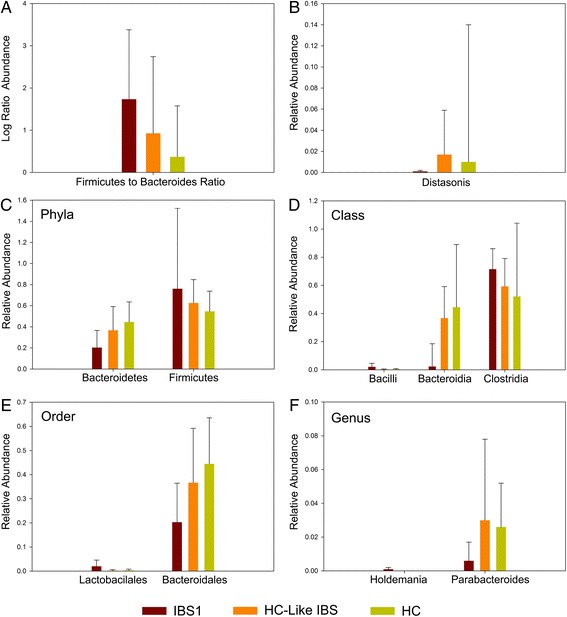
Results: Using unweighted Unifrac distances with hierarchical clustering on microbial data, samples were clustered into two IBS subgroups within the IBS population (IBS1 (n = 13) and HC-like IBS (n = 16)) and HCs (n = 23) (AUROC = 0.96, sensitivity 0.95, specificity 0.67). A Random Forest classifier provided further support for the differentiation of IBS1 and HC groups. Microbes belonging to the genera Faecalibacterium, Blautia, and Bacteroides contributed to this subclassification. Clinical features distinguishing the groups included a history of early life trauma and duration of symptoms (greater in IBS1), but not self-reported bowel habits, anxiety, depression, or medication use. Gut microbial composition correlated with structural measures of brain regions including sensory- and salience-related regions, and with a history of early life trauma.

Conclusions: The results confirm previous reports of gut microbiome-based IBS subgroups and identify for the first time brain structural alterations associated with these subgroups. They provide preliminary evidence for the involvement of specific microbes and their predicted metabolites in these correlations.

Keywords: Bacteroidetes; Brain-gut-microbiome axis; Firmicutes; Irritable bowel syndrome; Metagenome.


Figures

Fig. 1
Fig. 1
16s rRNA gene data revealed two distinct IBS subgroups, one indistinguishable from healthy controls. a Principal coordinate analysis (PCoA) on the unweighted Unifrac distance matrix from the rarefied data was used to evaluate the presence of clusters or groupings based upon operational taxonomic unit (OTU)-level microbial features. b Hierarchical clustering using average linkage was performed to visualize relationships among the samples based on similarity of microbial composition. Both procedures operate on a phylogenetically informed distance matrix computed using the unweighted UniFrac metric
Fig. 2
Fig. 2
Microbial composition of each group at the phylum and class level. Pie charts show the proportion of reads in each phylum (top) and class (bottom) for IBS1, HC-like IBS, and HCs
Fig. 3
Fig. 3
Microbial composition of each sample by group at the phylum and class level. Stacked vertical bar charts depict the variability in phyla- and class-level composition for individuals by groups
Fig. 4
Fig. 4
Group differences in the relative abundance of microbiota. Bar graphs depict the Firmicutes to Bacteroidetes ratio (a), the mean relative abundance for identifiable operational taxonomic units (b), and taxa demonstrating group differences at each taxonomic level (phylum, class, order, family, and genus (c-f)). Error bars represent standard deviations
Fig. 5
Fig. 5
Bacterial genes involved in the metabolism of neurotransmitters and short-chain fatty acids correlate with the surface area of the right inferior segment of the circular sulcus of the insula (R Inf Cir Ins). a Relative abundances in IBS1, HC-IBS, and HC are shown for four of the metagenes, e.g., genes predicted by PICRUSt associated with the surface area of the right inferior segment of the circular sulcus of the insula (R Inf Cir Ins). Statistical significance was calculated using the Mann-Whitney U test; *p < .05, **p < .01. The contribution of individual taxa to the significance of metagene differential abundance between IBS1 and HC was evaluated using FishTaco. The positive and negative effects of taxa on significance are shown separately for taxa more abundant in IBS1 and those more abundant in HC. Taxa could influence significance either by carrying the predicted gene (marked by an asterisks) or by being correlated with other taxa carrying the gene. “Other” refers to the total effect of all other taxa (out of 363) included in the analysis. b Surface area of the R Inf Cir Ins is plotted against the relative abundances of K00043 and the Peptostreptococcaceae OTU accounting for the majority of the predicted differential abundance of this metagene. Linear regression trendlines are shown along with the Pearson’s correlation coefficient and p value

References

    1. Simren M, Barbara G, Flint HJ, Spiegel BM, Spiller RC, Vanner S, et al. Intestinal microbiota in functional bowel disorders: a Rome foundation report. Gut. 2013;62(1):159–76. doi: 10.1136/gutjnl-2012-302167. - DOI - PMC - PubMed
    1. Mayer EA, Savidge T, Shulman RJ. Brain-gut microbiome interactions and functional bowel disorders. Gastroenterology. 2014;146(6):1500–12. doi: 10.1053/j.gastro.2014.02.037. - DOI - PMC - PubMed
    1. De Palma G, Collins SM, Bercik P. The microbiota-gut-brain axis in functional gastrointestinal disorders. Gut Microbes. 2014;5(3):419–29. doi: 10.4161/gmic.29417. - DOI - PMC - PubMed
    1. Drossman DA. Functional gastrointestinal disorders: history, pathophysiology, clinical features and Rome IV. Gastroenterol. 2016. Feb 19. [Epub ahead of print] - PubMed
    1. Spiller RC. Postinfectious irritable bowel syndrome. Gastroenterology. 2003;124(6):1662–71. doi: 10.1016/S0016-5085(03)00324-X. - DOI - PubMed

Publication types