. 2017 Jun 1;20(6):785-800.e8.
doi: 10.1016/j.stem.2017.03.008. Epub 2017 Apr 27.

Gli1+ Mesenchymal Stromal Cells Are a Key Driver of Bone Marrow Fibrosis and an Important Cellular Therapeutic Target

Affiliations

Gli1+ Mesenchymal Stromal Cells Are a Key Driver of Bone Marrow Fibrosis and an Important Cellular Therapeutic Target

Rebekka K Schneider et al. Cell Stem Cell. .

Erratum in

Abstract

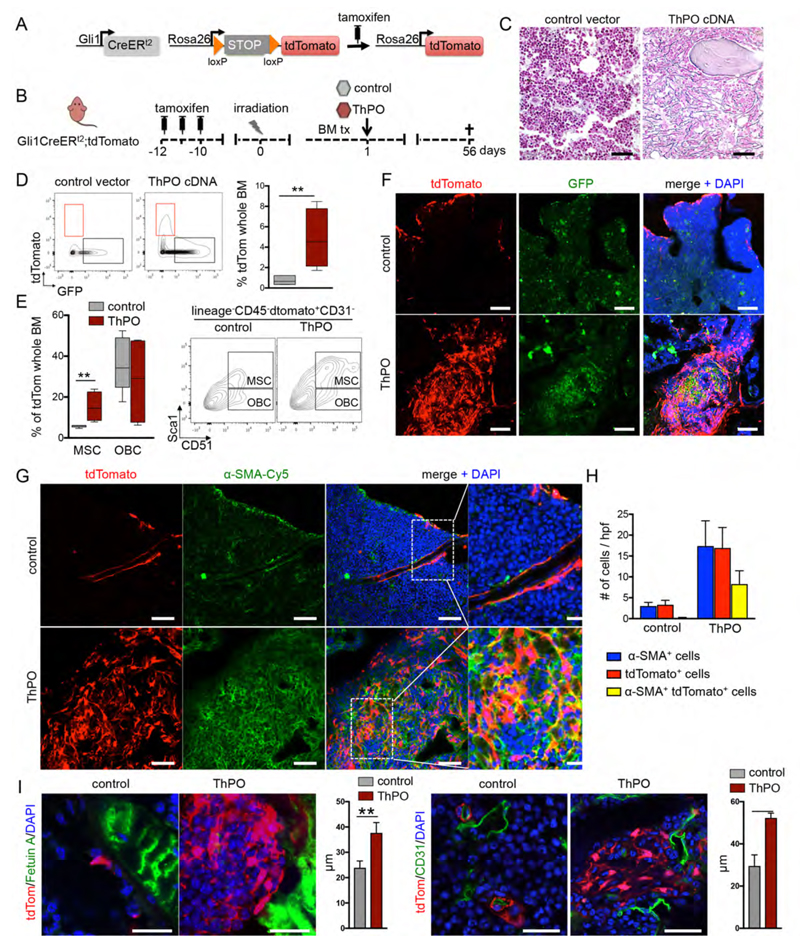
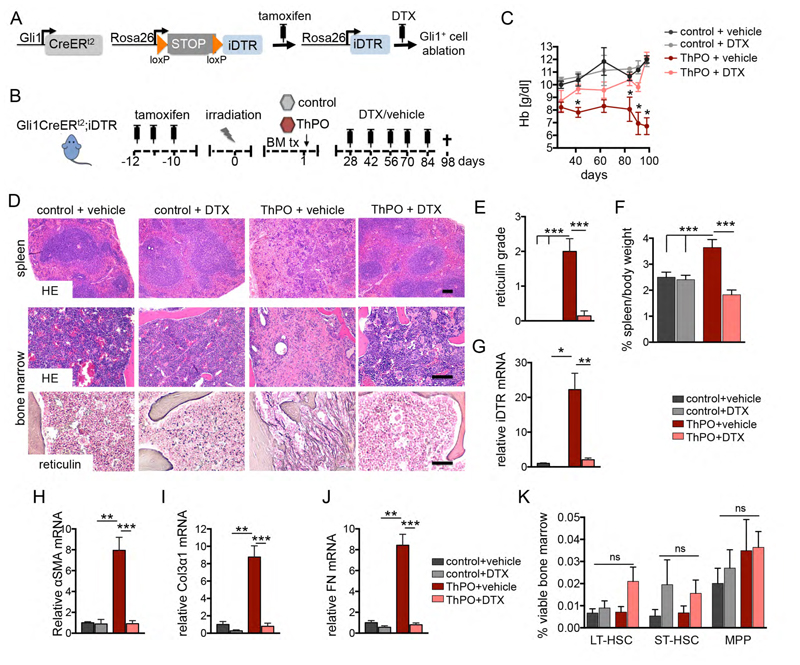
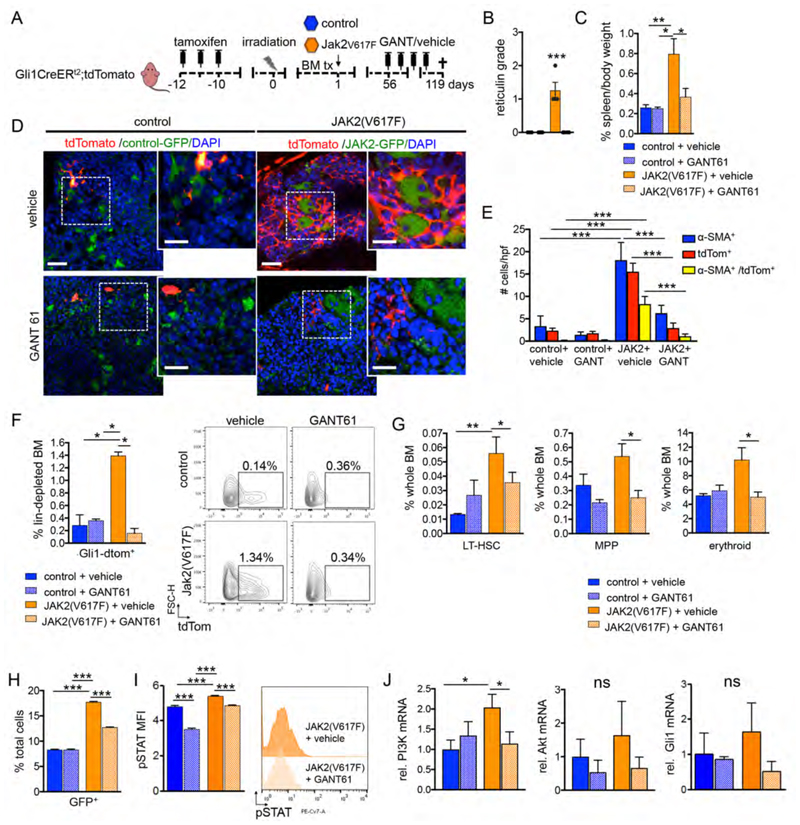
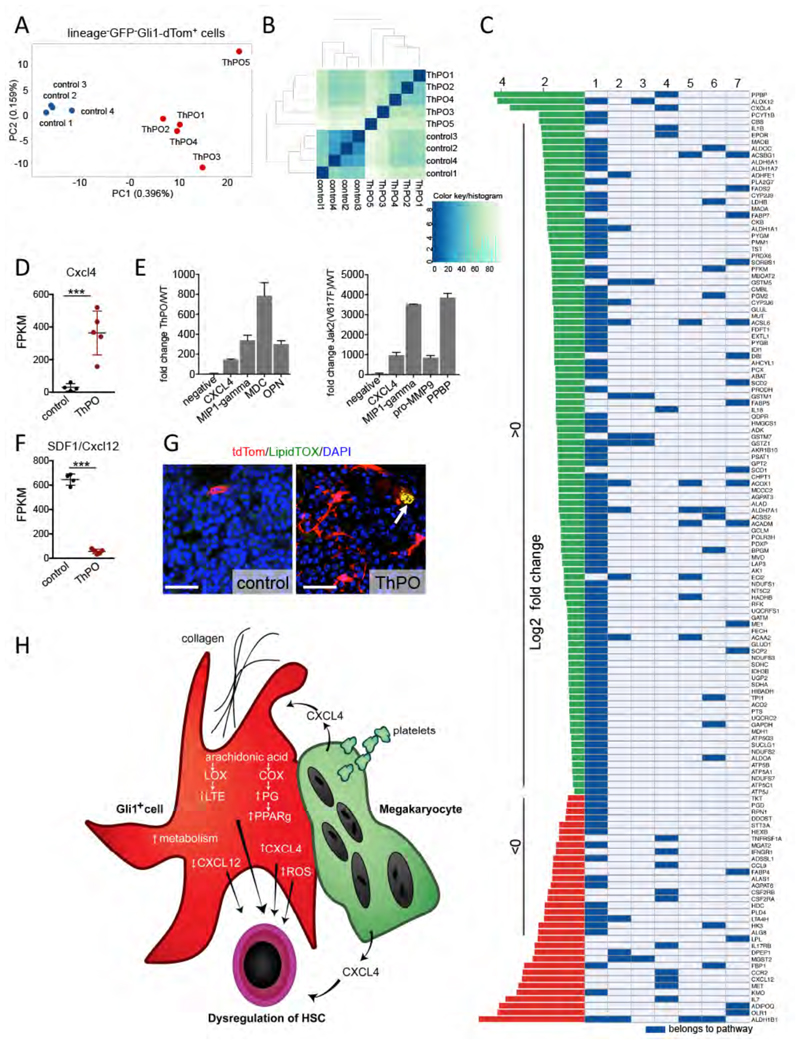
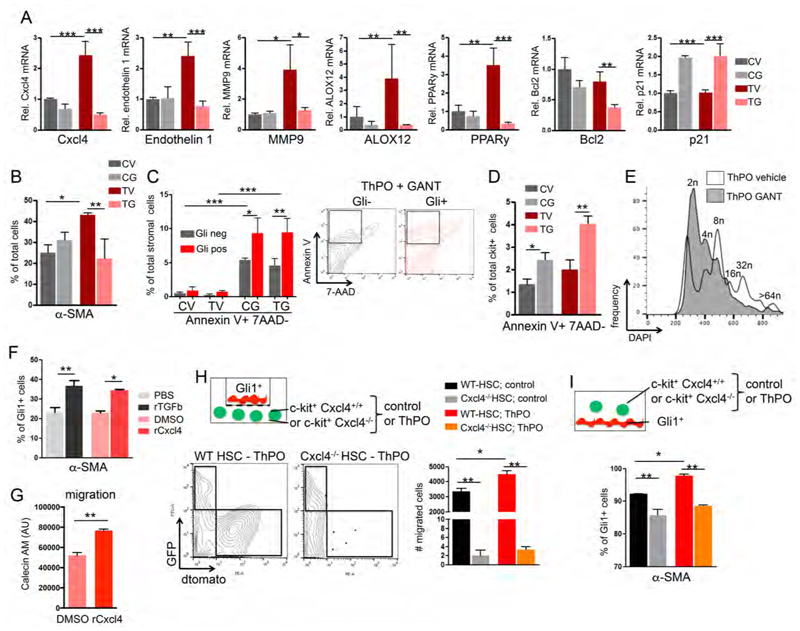
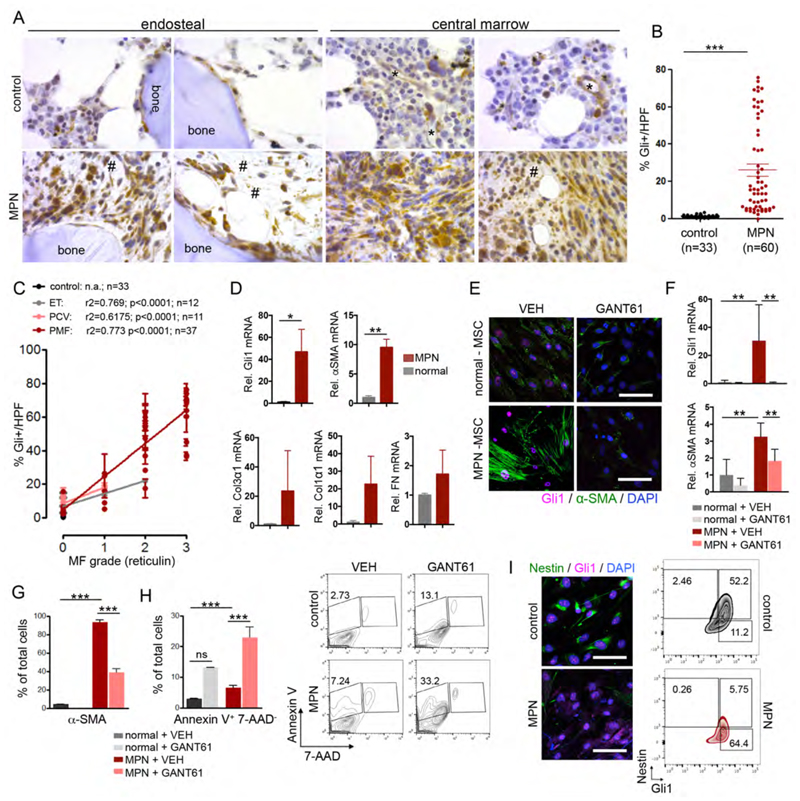
Bone marrow fibrosis (BMF) develops in various hematological and non-hematological conditions and is a central pathological feature of myelofibrosis. Effective cell-targeted therapeutics are needed, but the cellular origin of BMF remains elusive. Here, we show using genetic fate tracing in two murine models of BMF that Gli1+ mesenchymal stromal cells (MSCs) are recruited from the endosteal and perivascular niche to become fibrosis-driving myofibroblasts in the bone marrow. Genetic ablation of Gli1+ cells abolished BMF and rescued bone marrow failure. Pharmacological targeting of Gli proteins with GANT61 inhibited Gli1+ cell expansion and myofibroblast differentiation and attenuated fibrosis severity. The same pathway is also active in human BMF, and Gli1 expression in BMF significantly correlates with the severity of the disease. In addition, GANT61 treatment reduced the myofibroblastic phenotype of human MSCs isolated from patients with BMF, suggesting that targeting of Gli proteins could be a relevant therapeutic strategy.

Keywords: Gli1; bone marrow fibrosis; mesenchymal stem cells; myelofibrosis; myeloproliferative neoplasms.


Figures

Figure 1
Figure 1. Gli1+ cells reside in the perivascular and endosteal bone marrow niche in human and mice
(A) Representative images of bone marrows (BM) from bigenic Gli1CreERt2;tdTomato mice 10 days after tamoxifen application (3x10mg p.o.). Brightfield (BF) and Fetuin A stained images. Scale bars 50μm (B-C) Representative images and Z-Stack analyses of the perivascular BM niche. Scale bars 50μm. (D) Distribution of Gli1+ cells in the endosteal (endost), perisinusoidal (perisin) and periarteriolar (periart) niche; mean±SEM. (E-H) CD105, NG2 and Nestin expression by Gli1+ cells in the endosteal, perisinusoidal and periarteriolar niche; mean±SEM; arrows indicate co-expression in Gli1+ cells; arrowheads indicate no-expression in Gli1+ cells; scale bars 50μm in E-F, 25μm in G-H; mean±SEM. (I) Representative Z-Stack images and quantification of Gli1+ cell innervation by tyrosine hydroxylase (TyrHydr)-positive sympathic nerve fibres. Scale bars 25μm; mean±SEM. (J) Representative Z-Stack image and quantification of Gli1+ cells adjacent to glial fibrillary acidic protein (GFAP)-expressing glia cells. Scale bars 25μm. (K) Surface expression pattern of tdTomato+ cells from bigenic Gli1CreERt2; tdTomato mice as assessed by flow cytometry; mean±SEM. (L) Representative images of human bone marrows stained for Gli1. Arrows indicate Gli1 expressing cells. Scale bars: 50μm. (M) Surface expression profile of human Gli1+ MSCs; mean±SEM. See also Figure S1.
Figure 2
Figure 2. Gli1+ cells expand and become myofibroblasts in thrombopoietin (ThPO) induced bone marrow fibrosis
(A-B) Bigenic Gli1CreER;tdTomato mice were injected with tamoxifen (3x10mg p.o.) at 8 weeks of age, lethally irradiated at 10 days after the last tamoxifen dose and received c-kit enriched hematopoietic stem cells from wildtype littermates expressing either Thrombopoietin-cDNA (ThPO, n=5, 3 males) or control cDNA (control, n=5, 3 males; both lentiviral SFFV-iGFP vector backbone). Mice were sacrificed at 56 days after transplantation. (C) Representative images of reticulin stained bone marrows (BM) from control and ThPO group 56 days after transplantation. Scale bars 200μm. (D) Representative flow cytometric plots and quantification of tdTomato+ cells in the BM of control and ThPO group 56 days after transplantation. **p<0.01 by t-test. (box plot and whiskers, min to max). (E) Representative flow cytometric plots and quantification of the contribution of tdTomato+ cells to MSCs, and OBCs contained in the endosteal (Lin-/CD45-) BM stromal fraction in the control and ThPO group 56 days after transplantation. MSCs are tdTom+lin-CD45-CD31-Sca1+CD51+; OBCs are tdTom+lin-CD45- CD31-Sca1-CD51+; **p<0.01 by t-test. (box plot and whiskers, min to max). (F) Representative confocal images of BM from control and ThPO group. Scale bars 50μm. (G-H) Representative images and quantification of BM from the control and ThPO group stained for alpha smooth muscle actin (α-SMA). *p<0.05, ***p<0.001 versus the control group by t-test; scale bars 50μm, inserts 20μm. (I) Representative images of BM from the control and ThPO group stained for Fetuin A (left panel) and CD31 (right panel). The distance of Gli1+ cells to bone (Fetuin A+) and vasculature (CD31+) was quantified. **p<0.01 by t-test; mean±SEM; scale bars 25μm. See also Figure S2.
Figure 3
Figure 3. Genetic ablation of Gli1+ cells abolishes bone marrow fibrosis and rescues thrombopoietin induced bone marrow failure.
(A-B) Bigenic Gli1CreERt2;iDTR mice received tamoxifen (3x10mg p.o.), were lethally irradiated at 10 days after the last tamoxifen dose and transplanted with 2x10⁵ c-kit purified bone marrow (BM) cells from wild type littermates transduced with either control or ThPO cDNA. Mice were injected with diphtheriatoxin in order to ablate Gli1+ cells (DTX, 50ng/kg body weight i.p.) or vehicle (PBS) as indicated (control + vehicle n=3, 2 males; control+DTX n=4, 2 males; ThPO + vehicle n=9, 5 males; ThPO + DTX n=6, 4 males). (C) Time course of hemoglobin counts. *p<0.05 by t-test; mean±SEM. (D) Representative hematoxylin & eosin (HE) and reticulin stained images from spleen and BM. Scale bars 300μm. (E) Scoring of reticulin fibrosis grade. ***p<0.001 by one way ANOVA with posthoc Tukey; mean±SEM. (F) Spleen weight relative to body weight among the groups. ***p<0.001 by one way ANOVA with posthoc Tukey; mean±SEM. (G) mRNA expression of the symian diphtheriatoxin receptor (iDTR). *p<0.05 **p<0.01 by one way ANOVA with posthoc Tukey; mean±SEM. (H-J) Relative mRNA expression for the fibrotic readouts alpha smooth muscle actin (α-SMA), collagen 3α1 (Col3α1) and fibronectin. **p<0.01, ***p<0.001 by one way ANOVA with posthoc Tukey; mean±SEM. (K) Analysis of the HSC compartment, defined as long-term (LT; linlowSca1+ckit+CD48-CD150+), short-term (ST; linlowSca1+ckit+CD48-CD150-) HSCs and multipotent progenitor cells (MPP, linlowSca1+ckit+CD48+CD150-) in the bone marrow within the four different groups. mean±SEM; ns=non-significant by one way ANOVA with posthoc Tukey. See also Figure S3.
Figure 4
Figure 4. Gli1+ cells are myofibroblast precursors in JAK2(V617F) induced myelofibrosis and can be targeted pharmacologically by GANT61
(A) Bigenic Gli1CreERt2;tdTomato mice received tamoxifen (3x10mg p.o.) and were lethally irradiated 10 days after the last tamoxifen dose and transplanted with 2x10⁵ c-kit purified bone marrow (BM) cells from wild type littermates that had been transduced with either control (n=10) or Jak2(V617F) (n=10) cDNA (both MCSV-IRES-GFP retroviral backbone vector). Mice were injected with GANT61 (50mg/kg body weight) or vehicle (corn oil / ethanol) every other day between 8 and 17 weeks after transplantation (control + vehicle n=3, 2 males; control+GANT61 n=5, 3 males; Jak2(V617F) + vehicle n=4, 3 males; Jak2(V617F) + GANT61 n=4, 3 males). (B) Grading of reticulin fibrosis. ***p<0.001 versus all other groups by one way ANOVA with posthoc Tukey; mean±SEM. (C) Spleen weight was determined as a percentage of the body weight. *p<0.05, **p<0.001 by one way ANOVA with posthoc Tukey; mean±SEM. (D) Representative images of sternal bones. Scale bars 50μm, inserts 25μm. (E) Quantification of all alpha smooth muscle actin expressing cells (α-SMA+), Gli1 cells (tdTomato+) and Gli1-derived myofibroblasts (α-SMA+/tdTomato+) in the BM of mice transplanted with Jak2(V617F) (Jak2) or control that have been treated with GANT61 or vehicle. ***p<0.001 by one way ANOVA with posthoc Tukey; mean±SEM. (F) Representative flow cytometric plots and quantification of Gli1+ cells and within the lineage depleted BM. *p<0.05 by one way ANOVA with posthoc Tukey; mean±SEM. (G) Analysis of long-term (LT; linlowSca1+ckit+CD48-CD150+) and multipotent progenitor cells (MPP, linlowSca1+ckit+CD48+CD150-) as well as erythroid cells (Gr1-CD11b-CD3-CD19-Ter119+) by flow cytometry. *p<0.05, **p<0.01 by one way ANOVA with posthoc Tukey; mean±SEM. (H) c-kit+ purified HSPCs from wild type mice were transduced with either control or Jak2(V617F) cDNA (both MCSV-IRES-GFP retroviral backbone vector). 48 hours after transduction, cells were treated with GANT61 or vehicle. The gene marking (GFP+) was quantified by flow cytometry 48 hours after treatment. ***p<0.001 versus all other groups by one way ANOVA with posthoc Tukey; mean±SEM. (I) Quantification of the mean fluorescence intensity (MFI) and representative flow cytometric analysis of levels of phospho-STAT5 (p-STAT5) in c-kit+ cells transduced with Jak2(V617F) or control (GFP+) 48 hours after treatment with GANT61 or vehicle. GFP+ cells are shown in the histogram. ***p<0.001 versus all other groups by one way ANOVA with posthoc Tukey; mean±SEM. (J) c-kit+ purified HSPCs were transduced with Jak2(V617F) or control cDNA, were sort-purified by GFP-expression 48 hours after transduction and treated with GANT61 or vehicle 24 hours later. 24 hours after treatment, cells were harvested for RNA isolation and qt-RT-PCRs. Relative mRNA expression for Phosphatidylinositol-4,5-bisphosphate 3-kinase (PI3K), Akt and Gli1 is shown. *p<0.05 ns=non-signifcant by one way ANOVA with posthoc Tukey; mean±SEM. See also Figure S4.
Figure 5
Figure 5. Gli1+ cells in bone marrow fibrosis are transcriptionally distinct from Gli1+ cells in homeostasis.
Bigenic Gli1CreER;tdTomato mice were injected with tamoxifen (3x10mg p.o.) at 8 weeks of age, lethally irradiated at 10 days after the last tamoxifen dose and received c-kit enriched hematopoietic stem cells from wildtype littermates expressing either Thrombopoietin-cDNA (ThPO, n=5, 3 males) or control-cDNA (control, n=4, 3 males; both lentiviral SFFV-iGFP vector backbone). Mice were sacrificed at 70 days after transplantation. Gli1+ cells were sort-purified as lin-GFP-dtTomato+ and subjected to RNA sequencing. (A) Principal component analysis (PCA). (B) Heatmap representation with hierarchical clustering (C) Significantly directional enriched (median FDR >0.05) pathways. (D) Fragments per kilobase of exon per million fragments mapped (FPKM) values of CXCL4 in control and ThPO group; mean±SEM. (E) Cytokine analysis in serum and cytokine-free medium supernatant of ckit+ cells expressing ThPO or control (lentiviral SFFV-iGFP vector backbone) or Jak2(V617F) or control (both MCSV-IRES-GFP retroviral backbone). n=2. (F) FPKM value of stromal derived factor 1 (SDF 1/ CXCL12) in control and ThPO group; mean±SEM. (G) Representative images of bone marrow from Gli1CreERt2;tdTomato mice transplanted with bone marrow from wildtype littermates expressing either ThPO or control-cDNA stained with the neutral lipid staining LipidTOX. Scale bars 50μm. Arrow indicating LipidTOX positive Gli1+ cells. (H) Model for stroma-hematopoiesis interactions in bone marrow fibrosis. See also Figure S5.
Figure 6
Figure 6. Cxcl4 induces migration and myofibroblastic differentiation of Gli1+ cells
(A-E) tdTomato-Gli1+ stromal cells co-cultured with c-kit+ hematopoietic stem and progenitor cells (HSPCs) expressing either Thrombopoietin-cDNA (ThPO) or control cDNA (control vector=CV) were treated for 24 hours with vehicle or GANT61. CV= control vector, vehicle; CG= control vector and GANT61; TV= ThPO overexpression and vehicle; TG= ThPO overexpression and GANT61. (A) Relative mRNA expression in tdTomato-Gli1+ stromal cells is shown for platelet-factor 4 (Cxcl4), endothelin 1, matrix metalloproteinase 9 (MMP9), Arachidonate 12-lipoxygenase (ALOX12), Peroxisome proliferator-activated receptor gamma (PPARy), B-cell lymphoma gene 2 (Bcl2) and p21. **p<0.01, ***p<0.001 by one way ANOVA with posthoc Tukey; mean±SEM. n=3. (B) Quantification of Gli1+α-SMA+ myofibroblasts in stromal cells co-cultured with HSPCs (expressing control or ThPO cDNA) and treated with GANT61. *p<0.05, **p<0.01 by one way ANOVA with posthoc Tukey; mean±SEM. n=3. (C) Quantification and representative flow blots of early apoptosis (AnnexinV+7AAD-) in td-Tomato+ and td-Tomato- stromal cells co-cultured with HSPCs and treated with GANT61. *p<0.05, **p<0.01, ***p<0.001 by one way ANOVA with posthoc Tukey; mean±SEM. n=3. (D) Quantification of early apoptosis (AnnexinV+7AAD-) in c-kit+ HSPCs (expressing control or ThPO cDNA) co-cultured with stromal cells. *p<0.05, **p<0.01 by one way ANOVA with posthoc Tukey; mean±SEM. n=3. (E) Representative histogram showing ploidy in CD41+ ThPO-overexpressing megakaryocytes treated with GANT61 or vehicle. Representative data from one of three experiments. (F) Flow cytometric quantification of α-SMA+ in stromal cells treated with recombinant platelet factor 4 (rCxcl4) or TGFβ as a known stimulus for myofibroblastic differentiation (or respective controls). *p<0.05, **p<0.01 by t-test; mean±SEM. n=3. (G) Quantification of migration of tdTomato-Gli1+ stromal cells towards an rCxcl4 or control (DMSO) gradient. AU= arbitrary unit; mean±SEM; **p<0.01 by t-test. n=2 (H) Schematic, representative flow blots and quantification of tdTomato+ Gli1+ migration towards c-kit+ HSPCs isolated from Cxcl4-/- mice or littermate controls (Cxcl4+/+) expressing either ThPO or control cDNA (GFP+). **p<0.01 by one way ANOVA with posthoc Tukey; mean±SEM, n=3. (I) Schematic and quantification of α-SMA+ myofibroblast differentiation (flow cytometry) of tdTomato+ Gli1+ stromal cells co-cultured with c-kit+ HSPCs isolated from Cxcl4-/- mice or littermate controls expressing either ThPO or control cDNA (GFP+). *p<0.05, **p<0.01 by one way ANOVA with posthoc Tukey; mean±SEM. n=3. See also Figure S6
Figure 7
Figure 7. Increased Gli1 frequency correlates with fibrosis grade in human bone marrows and can be targeted pharmacologically
(A) Representative images of human bone marrow biopsies from control patients (MF=0) and patients with myelofibrosis stained for Gli1. *= sinusoids; #= amorphous matrix. Scale bars: 200μm. (B) Quantification of Gli1+ cell frequency in human bone marrows from healthy control patients (healthy) and MPN patients. 3 high power fields (HPF) (400x) were counted for each patient and the mean value calculated; each dot represents one patients (n=33 control; n=60 MPN patients p<0.05, ****p<0.0001 by t-test; mean±SEM. (C) Correlation of Gli1+ cell frequency and myelofibrosis (MF) grade in human bone marrow; mean±SEM. The myelofibrosis (MF)/reticulin grade was graded by hematopathologists at different institutions. Each dot represents one patient. ET: Essential Thrombocythemia; PCV: Polycythemia Vera; PMF: Primary Myelofibrosis. (D) Relative mRNA expression of Gli1 and the fibrotic readouts alpha smooth muscle actin (α-SMA), collagen3α1 (Col3α1), collagen1α1 (Col1α1) and fibronectin (FN) in human mesenchymal stem cells (MSCs) isolated from bone marrows of patients with myeloproliferative neoplasia (MPN, n=4) or healthy controls (control, n=4). *p<0.05, **p<0.001 by t-test; mean±SEM, (E) Representative imagesof human mesenchymal stem cells (MSCs) from bone marrow biopsies of patients with myeloproliferative neoplasia (MPN-MSCs, n=4) or healthy controls (control MSCs, n=4) stained for alpha-smooth muscle actin (α-SMA) and Gli1 24 hours after treatment with GANT61 (10μM) or vehicle (DMSO, VEH). **p<0.01 by one way ANOVA with posthoc Tukey. Scale bars 20μm. (F) Relative Gli1 and alpha smooth muscle actin (α-SMA) expression in human MSCs from healthy donors (control) and MPN patients after treatment with GANT61 (n=4 each) or vehicle (DMSO, VEH, n=4 each). **p<0.01 by one way ANOVA with posthoc Tukey. (G) Flow cytometric quantification of αSMA after treatment with GANT61 (n=3 each) or vehicle (DMSO, VEH, n=3 each). ***p<0.001 by one way ANOVA with posthoc Tukey. (H) Flow cytometric quantification and representative flow blots of Annexin V staining after treatment with GANT61 (n=4 each) or vehicle (DMSO, VEH, n=4 each). ***p<0.001 by one way ANOVA with posthoc Tukey. (I) Representative images and flow cytometric plots of MSCs from healthy donors (control) and MPN patients co-stained for Gli1 and Nestin. Scale bars 20μM mean±SEM. See also Figure S7 and supplementary table S1/S2 for patient characteristics.

Comment in

References

    1. Aberger F, Ruiz IAA. Context-dependent signal integration by the GLI code: the oncogenic load, pathways, modifiers and implications for cancer therapy. Seminars in cell & developmental biology. 2014;33:93–104. - PMC - PubMed
    1. Abraham NG, Feldman E, Falck JR, Lutton JD, Schwartzman ML. Modulation of erythropoiesis by novel human bone marrow cytochrome P450-dependent metabolites of arachidonic acid. Blood. 1991;78:1461–1466. - PubMed
    1. Arranz L, Sanchez-Aguilera A, Martin-Perez D, Isern J, Langa X, Tzankov A, Lundberg P, Muntion S, Tzeng YS, Lai DM, et al. Neuropathy of haematopoietic stem cell niche is essential for myeloproliferative neoplasms. Nature. 2014;512:78–81. - PubMed
    1. Bares V, Ge X. gskb: Gene Set data for pathway analysis in mouse. 2015 R package version 161.
    1. Bhagwat N, Keller MD, Rampal RK, Shank K, de Stanchina E, Rose K, Amakye D, Levine RL. Improved Efficacy Of Comibnation Of JAK2 and Hedgehog Inhibitors in Myelofibrosis. Blood. 2013;122

MeSH terms