. 2015 Dec;18(10):539-553.
doi: 10.1016/j.mattod.2015.05.002.

Engineering cancer microenvironments for in vitro 3-D tumor models

Affiliations

Engineering cancer microenvironments for in vitro 3-D tumor models

Waseem Asghar et al. Mater Today (Kidlington). 2015 Dec.

Abstract

The natural microenvironment of tumors is composed of extracellular matrix (ECM), blood vasculature, and supporting stromal cells. The physical characteristics of ECM as well as the cellular components play a vital role in controlling cancer cell proliferation, apoptosis, metabolism, and differentiation. To mimic the tumor microenvironment outside the human body for drug testing, two-dimensional (2-D) and murine tumor models are routinely used. Although these conventional approaches are employed in preclinical studies, they still present challenges. For example, murine tumor models are expensive and difficult to adopt for routine drug screening. On the other hand, 2-D in vitro models are simple to perform, but they do not recapitulate natural tumor microenvironment, because they do not capture important three-dimensional (3-D) cell-cell, cell-matrix signaling pathways, and multi-cellular heterogeneous components of the tumor microenvironment such as stromal and immune cells. The three-dimensional (3-D) in vitro tumor models aim to closely mimic cancer microenvironments and have emerged as an alternative to routinely used methods for drug screening. Herein, we review recent advances in 3-D tumor model generation and highlight directions for future applications in drug testing.


Conflict of interest statement

Conflict of interest statement Dr. Utkan Demirci is a founder of, and has an equity interest in: (i) DxNow Inc., a company that is developing microfluidic and imaging technologies for point-of-care diagnostic solutions, and (ii) Koek Biotech, a company that is developing microfluidic IVF technologies for clinical solutions. Dr. Utkan Demirci’s interests were viewed and managed in accordance with their conflict of interest policies.

Figures

FIGURE 1
FIGURE 1
Methods and materials used to engineer 3-D cancer models. To generate 3-D cancer models various technologies are used including spheroids, bio-printing, and assembly. These technologies are implemented using numerous kinds of materials such as hydrogels, scaffolds, and basement membrane extracts. Controlling physical and chemical factors and mimicking the native microenvironment results in tumor responses such as cancer cell proliferation, aggression, and invasion.
FIGURE 2
FIGURE 2
High throughput methods to generate spheroids through hanging drop approach. (a) (i) Actual image of the 384 hanging drop array plate highlighting the key features and specifications. (ii) Schematic of the hanging drop formation process in the array plate. Cell suspension is dispensed into the access hole to the bottom surface of the plate using pipette and within hours, individual cells start to aggregate and eventually form into a single spheroid after 1 day. (iii) Schematic showing the humidification chamber that was used to culture 3-D spheroids in the hanging drop array plate format. The 384 hanging drop array plate was sandwiched between a 96-well plate filled with distilled water. Reprinted by copyright permissions from [57,67]. (b) (i) Schematic of the embryonic body formation process using hanging drop with integrated bio-printing approach. This approach can be utilized to make 3-D cancer models. Droplets of cell-medium suspension were printed onto the lid of a Petri dish and were hung up for 24 h to allow for EB aggregation. The formed EBs were transferred to a 96-well plate for additional culture up to 96 h. (ii) Images of uniformed-sized EBs formed using bio-printing with various droplet sizes: 1, 4, 10, and 20 μl. (iii) Fluorescent images of EBs after 96 h of culture. Reprinted by copyright permissions from [68].
FIGURE 3
FIGURE 3
Schematic of bio-printing technologies. (a) Schematic of the valve-based bio-printing setup used to make a 3-D co-culture of human ovarian cancer cells and fibroblasts. (b) Thermal and piezoelectric ink-jet printing. The thermal technique heats the resistor and expands the air bubbles. The piezoelectric technique charges crystals that expand. (c) Schematic of the laser printing setup where laser is focused into a cell suspension, and the optical force produced because of the difference in refractive indexes moves the cells onto an acceptor substrate. The cell-gel solution is propelled forward as a deposit by the pressure of a laser-induced vapor bubble (right).
FIGURE 4
FIGURE 4
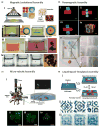
Magnetic Fe3O4 encapsulated PLGA microparticles and iron oxide-containing hydrogels. (a) (i) Schematic representation of magnetic Fe3O4-loaded PLGA microparticles that were used for 3-D tumor spheroid cultures. (ii) SEM image of Fe3O4-loaded PLGA microparticles. (iii) Optical image of a cluster of KB tumor cells and PLGA microparticles. (iv) Optical image of KB tumor cell clusters (indicated by a white arrow) attached on the surface of magnetic PLGA microparticles. Reprinted by copyright permissions from [104]. (b) Human glioblastoma cells (lower arrow) mixed with magnetic Fe3O4-loaded containing hydrogel held at the air–medium interface by a magnet. Scale bar, 5 mm. (c) Comparison of 2-D with 3-D cell growth. Phase contrast (top row) and fluorescence (red, bottom row) images of levitated glioblastoma cells. The cells were monitored for 8 days. Scale bar, 200 mm. (d) Confrontation assay of magnetically levitated multicellular spheroids. (i) Bright-field and fluorescence images of human glioblastoma cells (green) and normal human astrocytes (red). The cells were cultured separately and then magnetically guided together. (ii) Images showing confrontation between human glioblastoma cells and normal astrocytes monitored for 10.5 days. Invasion of normal human astrocytes containing spheroid by human glioblastoma cells serves as a standard assay to analyze glioblastoma invasiveness. Scale bar, 200 mm. Reprinted by copyright permissions from [101].
FIGURE 5
FIGURE 5
(a) Fabrication and magnetic levitational soft living materials. Reprinted by copyright permissions from [108]. (i) Schematic of hydrogel and cell seeded microbead fabrication. (ii) Paramagnetic levitational self-assembly of soft components. (iii) Red and blue hydrogels assembled at different levels because of their polymer concentrations. (vi) 3T3 seeded microbeads were self-assembled with Paramagnetic levitation. The cross sections of the layers were obtained by cutting the assembled construct into two hemispheres. (b) Paramagnetic levitation assembly of MNP-free hydrogel. (i–iii) Various hydrogel assemblies. Hydrogels were labeled with FITC-dextran (green) and Rhodamine B. (red) indicating control over the assembled constructs. (iv) Merged fluorescent image of layer-by-layer 3-D assembly. Multi-layer 3-D constructs were fabricated by stacking layers of hydrogels. (v) Celtic-shaped patterning chamber. Each well is a reservoir for red, blue, or green hydrogels. Images show linear shape assembly of hydrogels with red gel at the front, in the middle, and at the back. Scale bar is 1 mm. Reprinted by copyright permissions from [95]. (c) Micro-robotic assembly of hydrogels and cells. (i) Magnetic coil system used to actuate magnetic micro-robots remotely. These untethered magnetic micro-robot were used to arrange hydrogels driven by magnetic field. Scale bar, 1 mm. Fluorescence images of National Institutes of Health (NIH) 3T3 mouse embryonic fibroblast cell-encapsulating hydrogels after the assembly of (ii) T-shape and (iii) square-shape constructs. Scale bar, 500 μm. (iv) Fluorescence image of three-dimensional heterogeneous assembly of HUVEC, 3T3 and cardiomyocyte encapsulating hydrogels. Scale bar, 500 μm. Reprinted by copyright permissions from [96]. (d) Liquid-based templated assembly by Faraday waves. (i) Schematic demonstration of liquid-based templated assembly by Faraday waves. Dynamic reconfiguration of the assembled structures is achieved by setting vibrational parameters. (fA, aA) and (fB, aB) are vibrational frequencies and accelerations for the formation of structures A and B, respectively. By tuning the initial chamber with (fA, aA) and (fB, aB), assembly of the structures A and B from dispersed floaters can be performed, as well as the reversible transitions between the structures. (ii) Assembly of GelMA hydrogel units (dark blue) into various structures. (iii) Assembly of size-varied hydrogel units. PEG hydrogel units (light blue) with sizes of 0.5, 1, and 2 mm were assembled into the same pattern. Scale bars: 4 mm. Reprinted by copyright permissions from [110].
FIGURE 6
FIGURE 6
Influence of fibroblast on co-units formations in collagen hydrogel. Fibroblast cells (green), myoepithelial cells (red) and MCF-7 cancer cells (blue). (a) (i) showed cell organization at the day 1. (ii) Cell organization at day 7 showed the homing of myoepithelial cells around the cluster of MCF-7 cancer cells. The normal fibroblast cells were arranged around the co-units and had no effect on co-unit formation. (iii) Low power image of co-units. (b) (i) and (ii) show the disruption of co-units once the tumor-associated fibroblast were added. (iii) Low power image of disrupted co-units. Reprinted by copyright permissions from [125]
FIGURE 7
FIGURE 7
Cancer cells were cultured on 3-D PLG scaffolds and 2-D culture plates before implanting in mouse models. (a) Tumor mass grown in mouse model after preculture of OSCC-3 cells in 3-D PLG scaffold (right) and 2-D culture plates (left). Tumor grown in 3-D model was of higher weight and volume. (b) Tumor mass grown in mouse model after preculture of mouse LLC cells in 3-D PLG scaffold (right) and 2-D culture plate (left). Scale bars are 5 mm in all images. Reprinted by permission from [37].
FIGURE 8
FIGURE 8
Scanning electron microscope (SEM) images of the three cell lines of prostate cancer cells cultured in different models (2-D, Matrigel and Chitosan-Alginate (CA) 3-D model). (a) SEM images of LNCaP cancer cells. (b) SEM images of C4-2 cancer cells. (c) SEM images of C4-2B cancer cells. The 2-D culture formed flat cell sheets whereas Matrigel and CA 3-D cultures formed spheroids mimicking in vivo tumor growth. Scale bars are 40 μm. Reprinted by copyright permissions from [2].

References

    1. Bissell MJ, Radisky D. Cancer. 2001;1(1):46. - PMC - PubMed
    1. Florczyk SJ, et al. Adv Healthcare Mater. 2012;1(5):590. - PMC - PubMed
    1. Asghar W, et al. Cancer Targeted Drug Delivery. Springer; 2013. In vitro three-dimensional cancer culture models; p. 635.
    1. Shin CS, et al. Mol Pharm. 2013;10(6):2167. - PMC - PubMed
    1. Krausz E, et al. J Biomol Screen. 2013;18(1):54. - PubMed