. 2017 Mar 11;3(1):vex006.
doi: 10.1093/ve/vex006. eCollection 2017 Jan.

Transmission patterns and evolution of respiratory syncytial virus in a community outbreak identified by genomic analysis

Affiliations

Transmission patterns and evolution of respiratory syncytial virus in a community outbreak identified by genomic analysis

Charles N Agoti et al. Virus Evol. .

Abstract

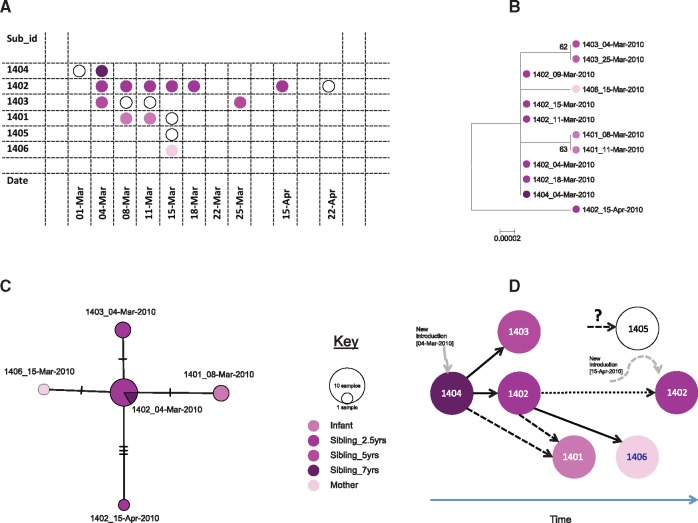
Detailed information on the source, spread and evolution of respiratory syncytial virus (RSV) during seasonal community outbreaks remains sparse. Molecular analyses of attachment (G) gene sequences from hospitalized cases suggest that multiple genotypes and variants co-circulate during epidemics and that RSV persistence over successive seasons is characterized by replacement and multiple new introductions of variants. No studies have defined the patterns of introduction, spread and evolution of RSV at the local community and household level. We present a whole genome sequence analysis of 131 RSV group A viruses collected during 6-month household-based RSV infection surveillance in Coastal Kenya, 2010 within an area of 12 km2. RSV infections were identified by regular symptom-independent screening of all household members twice weekly. Phylogenetic analysis revealed that the RSV A viruses in nine households were closely related to genotype GA2 and fell within a single branch of the global phylogeny. Genomic analysis allowed the detection of household-specific variation in seven households. For comparison, using only G gene analysis, household-specific variation was found only in one of the nine households. Nucleotide changes were observed both intra-host (viruses identified from same individual in follow-up sampling) and inter-host (viruses identified from different household members) and these coupled with sampling dates enabled a partial reconstruction of the within household transmission chains. The genomic evolutionary rate for the household dataset was estimated as 2.307 × 10 - 3 (95% highest posterior density: 0.935-4.165× 10 - 3) substitutions/site/year. We conclude that (i) at the household level, most RSV infections arise from the introduction of a single virus variant followed by accumulation of household specific variation and (ii) analysis of complete virus genomes is crucial to better understand viral transmission in the community. A key question arising is whether prevention of RSV introduction or spread within the household by vaccinating key transmitting household members would lead to a reduced onward community-wide transmission.

Keywords: RSV; WAIFW; community transmission; full-genome sequencing; household transmission.


Figures

Figure 1.
Figure 1.
Geographical distribution of the nine studied households which each had at least one assembled genome. Also shown is the Mombasa-Malindi highway, roads and schools in the study area. Light grey lines indicate administrative sub-location boundaries.
Figure 2.
Figure 2.
Nucleotide differences between viruses (total = 130) detected within the individual households. Each panel is a single household. The viruses were compared to the earliest virus genome sequenced from the same household. Vertical colored bars show the nucleotide differences. Red is a change to T, orange is a change to A, purple is a change to C and blue is a change to G. Grey is a deletion or an non-sequenced portion of the genome. Household six is excluded as only a single genome sequence was obtained. A python script to generate this figure is available at https://github.com/mlcotten/RSV_household_scripts.
Figure 3.
Figure 3.
A ML inferred phylogenetic tree showing the global phylogenetic context of the RSV A household study genomes. The taxa of the household study viruses (n= 103) are in red while viruses from the rest of Kenya (inpatient) are colored blue. The taxa of RSV A viruses from around the globe are colored by continent of origin. Asterisk mark has been placed next to major branches with a bootstrap support of >70%.
Figure 4.
Figure 4.
The sequence relatedness of the household study RSV A viruses. (a) A time-scaled phylogenetic tree of the 103 genome sequenced household study viruses inferred in BEAST program. The genomes are represented by a filled circle colored differently for each household (color scheme similar to Fig. 1). (b) A median-joining (MJ) haplotype network constructed from the 103 household genomes. Each colored vertex represents a sampled viral haplotype, with different colors indicating the different households of origin. The size of the vertex is relative to the number of sampled isolates. Hatch marks indicate the number of mutations along each edge. Small black circles within the network indicate unobserved internal nodes.
Figure 5.
Figure 5.
Inferred virus transmission patterns within household 14. (a) Temporal infection patterns. Every rectangular box represent a sample collected from members of the household 14, if there is a circle inside implies the sample was RSV A positive. Unfilled circle implies specimen was not sequenced while filled colored circle implies sample was sequenced (whole genome). (b) A ML phylogenetic tree from whole genome sequences of 12/18 sequences sequenced. Same circle color for sample from the same individual. (c) A median joining haplotype network of 12 genomes. Each vertex presents a sampled viral haplotype, with different colors indicating different individuals who provided the sample. The size of the each vertex is relative to the number of sampled isolates. Hatch marks indicate the number of mutations along each edge. (d) The putative inferred transmission events. Continuous arrow indicates where the transmission link was inferred as highly likely while dotted arrows indicate where multiple alternative scenarios could have been the source of infection.

References

    1. Agoti C. N. et al. (2015a) ‘Successive Respiratory Syncytial Virus Epidemics in Local Populations Arise from Multiple Variant Introductions, Providing Insights into Virus Persistence’, Journal of Virology, 89/22: 11630–42. - PMC - PubMed
    1. Agoti C. N. et al. (2015b) ‘Local Evolutionary Patterns of Human Respiratory Syncytial Virus Derived From Whole-Genome Sequencing’, Journal of Virology, 89/7: 3444–54. - PMC - PubMed
    1. Bankevich A. et al. (2012) ‘SPAdes: A New Genome Assembly Algorithm and its Applications to Single-Cell Sequencing’, Journal of Computational Biology, 19/5: 455–77. - PMC - PubMed
    1. Bose M. E. et al. (2015) ‘Sequencing and Analysis of Globally Obtained Human Respiratory Syncytial Virus A and B Genomes’, PLoS One, 10/3: e0120098. - PMC - PubMed
    1. Cane P. A. (2001) ‘Molecular Epidemiology of Respiratory Syncytial Virus’, Reviews in Medical Virology, 11/2: 103–16. - PubMed