

doi: 10.1016/j.dib.2017.03.041.
eCollection 2017 Jun.
Computational refinement of spectroscopic FRET measurements
Affiliations
- PMID: 28459092
- PMCID: PMC5397103
- DOI: 10.1016/j.dib.2017.03.041
Item in Clipboard
Computational refinement of spectroscopic FRET measurements
Data Brief.
.
Abstract
This article supplies raw data related to a research article entitled "Joint refinement of FRET measurements using spectroscopic and computational tools" (Kyrychenko et al., 2017) [1], in which we demonstrate the use of molecular dynamics simulations to estimate FRET orientational factors in a benchmark donor-linker-acceptor system of enhanced cyan (ECFP) and enhanced yellow (EYFP) fluorescent proteins. This can improve the recalculation of donor-acceptor distance information from single-molecule FRET measurements.
Keywords: ECFP; EYFP; FRET; Fluorescent protein; Single molecule, Molecular dynamics simulations.
Figures

Scheme of an ECFP-donor and EYFP-acceptor FRET pair linked by a flexible peptide bridge (GGSGGS)3 referred to as ECFP-l3-EYFP.

(A) The series of the four different starting configurations of ECFP-l3-EYFP (runs 1–4) were run in parallel to achieve adequate convergence statistics. (Left) MD snapshots of the initial conformations of ECFP-l3-EYFP. (Right) MD snapshots of final equilibrium conformation of ECFP-l3-EYFP, taken at the end of the MD sampling.

Parallel MD sampling of ECFP-l3-EYFP. The series of the four different starting configurations of ECFP-l3-EYFP (run 1–4) were run in parallel to achieve adequate convergence statistics.
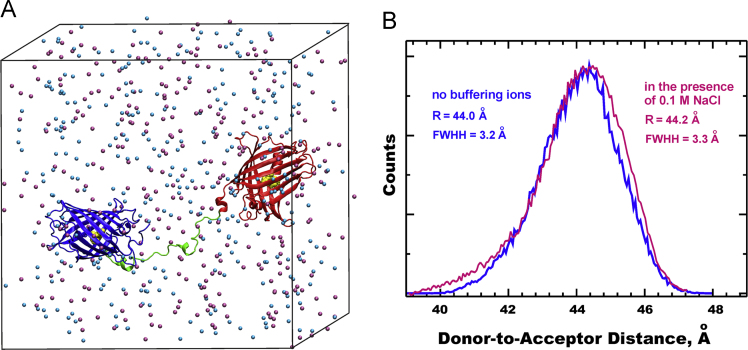
MD simulations of ECFP-to-EYFP distance. (A) Snapshot of ECFP-l3-EYFP in a MD box in the presence of 0.1 M buffering ions Na+ (cyan balls) and Cl− (mauve balls). (B) Comparison of ECFP-to-EYFP distance distributions calculated in the absence (blue) and in the presence of 0.1 M NaCl (magenta).

(A) The transition dipole moments of the ECFP donor and EYFP acceptor chromophores are shown as vectors µD and µA, respectively. The angles ΘD and ΘA define the dipole orientations with respect to the connecting unit distance vector RDA, whereas φ is the angle between the two planes. (B) The definition of the orientation factor κ2.

Comparison of the MD-simulated distribution of <κ2> (cyan) with the theoretical curve for an ideal unrestricted isotropic dynamic orientation of dipoles <κ2>=2/3 (blue).

(A) Comparison of the experimentally observed sm-FRET efficiency (grey bars) and MD-reconstructed distribution of FRET probability. (B) Comparison of ECFP-to-EYFP distance distribution histograms calculated by the direct MD sampling (blue) and reconstructed from the MD-estimated EDA, under the standard simplifying assumption of unique R0=48 Å (green) (Raw data associated with this Figure are provided in Supplementary files).
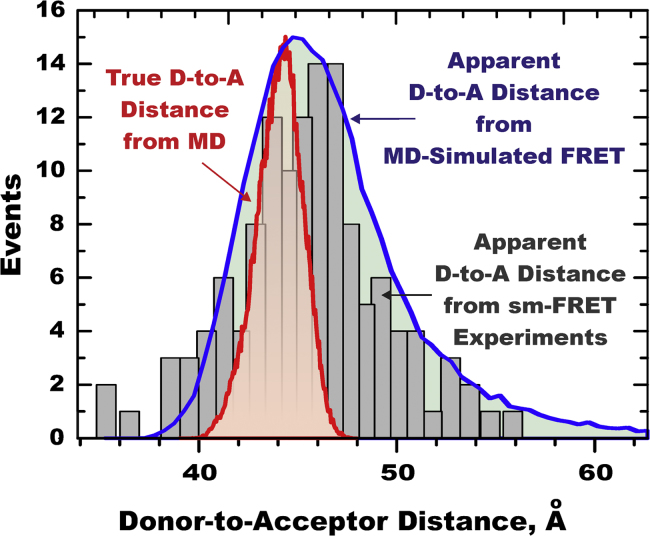
Comparison of True and Apparent distance distributions in ECFP-l3-EYFP model FRET system. True Donor-to-Acceptor distance distribution (red) is calculated directly from MD trace without any assumptions. Apparent Donor-to-Acceptor distance distributions are calculated from either experimental sm-FRET data (black) or MD-generated FRET data, assuming an average orientation factor <κ2>=0.69 (and subsequently unique value of R0=48 Å) for the entire population of conformations. (Raw data associated with this Figure are provided in Supplementary files).
References
-
- Kyrychenko A., Rodnin M.V., Ghatak C., Ladokhin A.S. Joint refinement of FRET measurements using spectroscopic and computational tools. Anal. Biochem. 2017;522:1–9. - PubMed
-
- Kyrychenko A., Wu F., Thummel R.P., Waluk J., Ladokhin A.S. Partitioning and localization of environment-sensitive 2-(2′-pyridyl)- and 2-(2′-pyrimidyl)-indoles in lipid membranes: a joint refinement using fluorescence measurements and molecular dynamics simulations. J. Phys. Chem. B. 2010;114:13574–13584. - PMC - PubMed
LinkOut - more resources
Full Text Sources
Other Literature Sources
