. 2017 Apr 7:2:25.
doi: 10.12688/wellcomeopenres.11253.2.

A genomic atlas of human adrenal and gonad development

Affiliations

A genomic atlas of human adrenal and gonad development

Ignacio Del Valle et al. Wellcome Open Res. .

Abstract

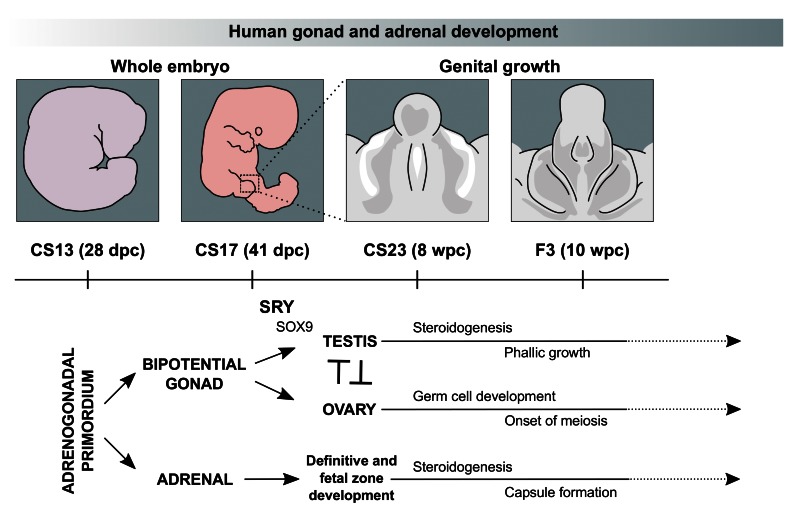
Background: In humans, the adrenal glands and gonads undergo distinct biological events between 6-10 weeks post conception (wpc), such as testis determination, the onset of steroidogenesis and primordial germ cell development. However, relatively little is currently known about the genetic mechanisms underlying these processes. We therefore aimed to generate a detailed genomic atlas of adrenal and gonad development across these critical stages of human embryonic and fetal development.

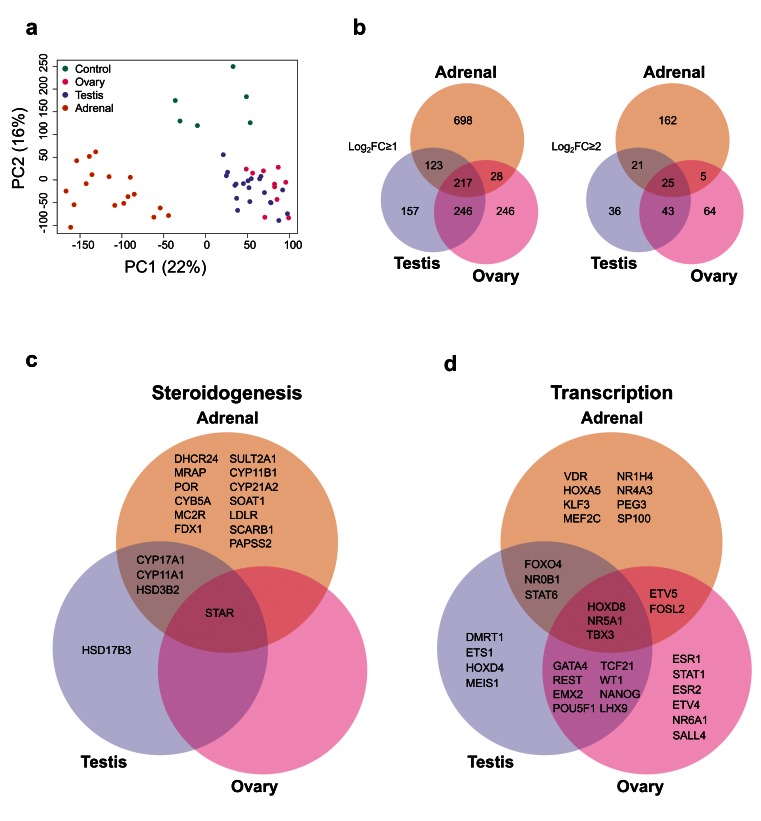
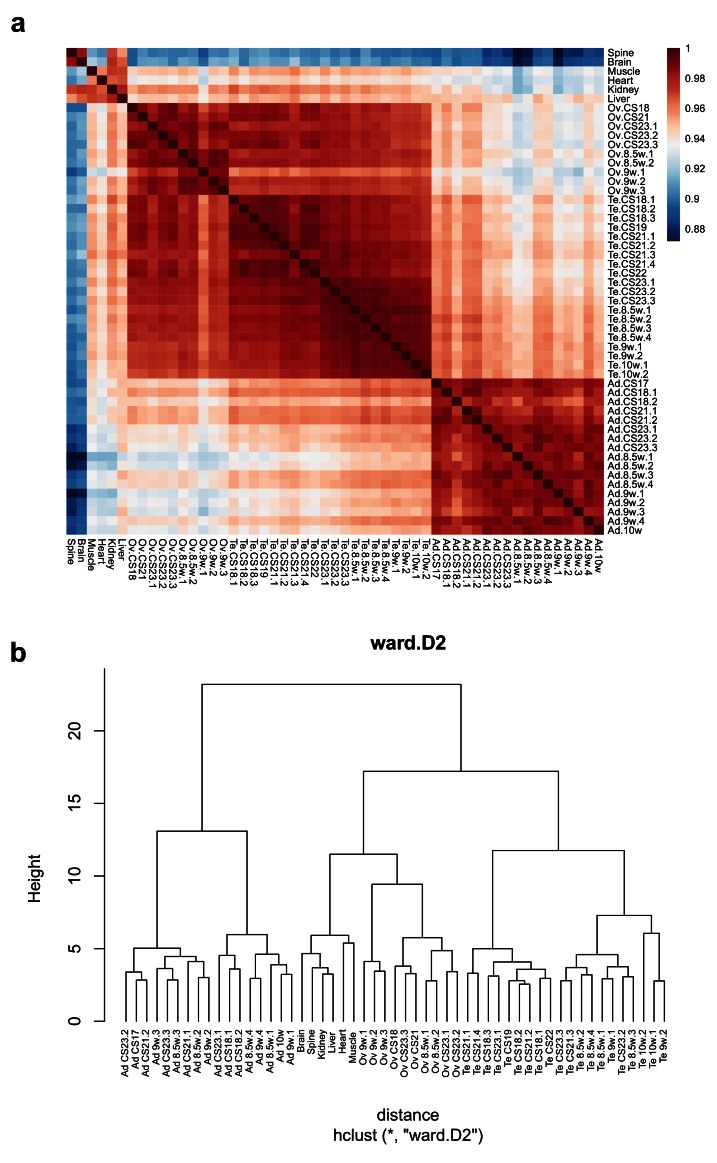
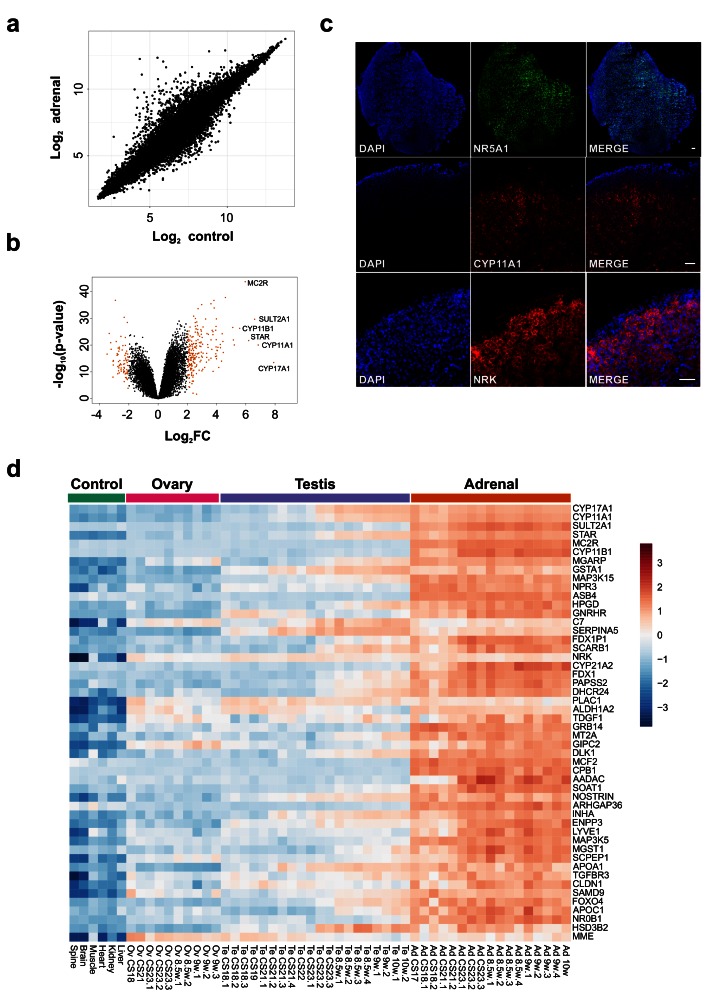
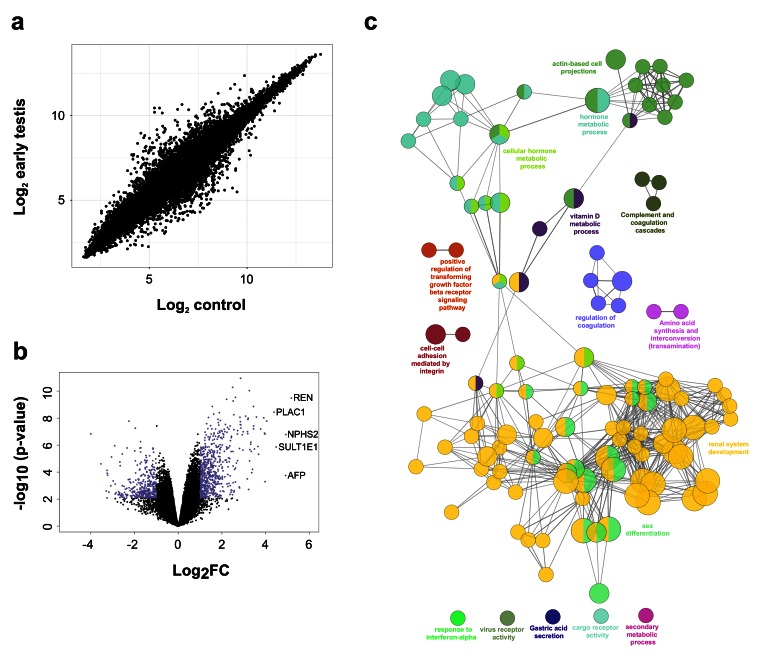
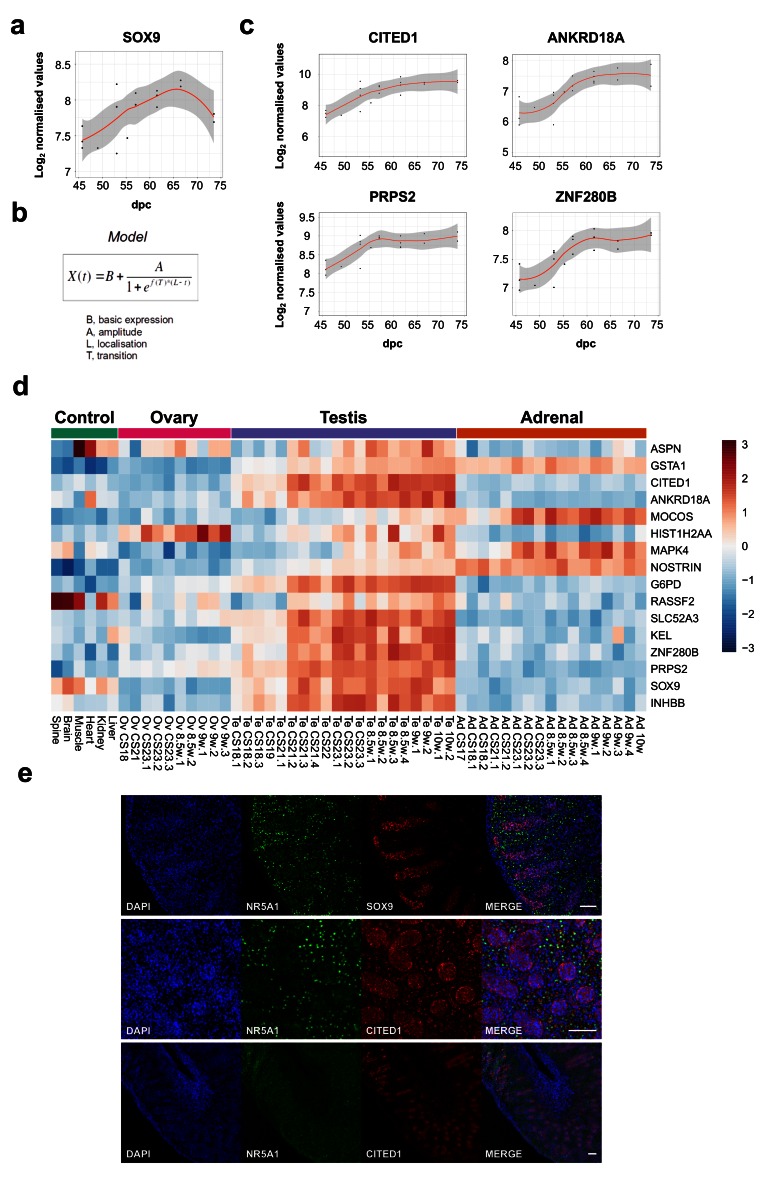
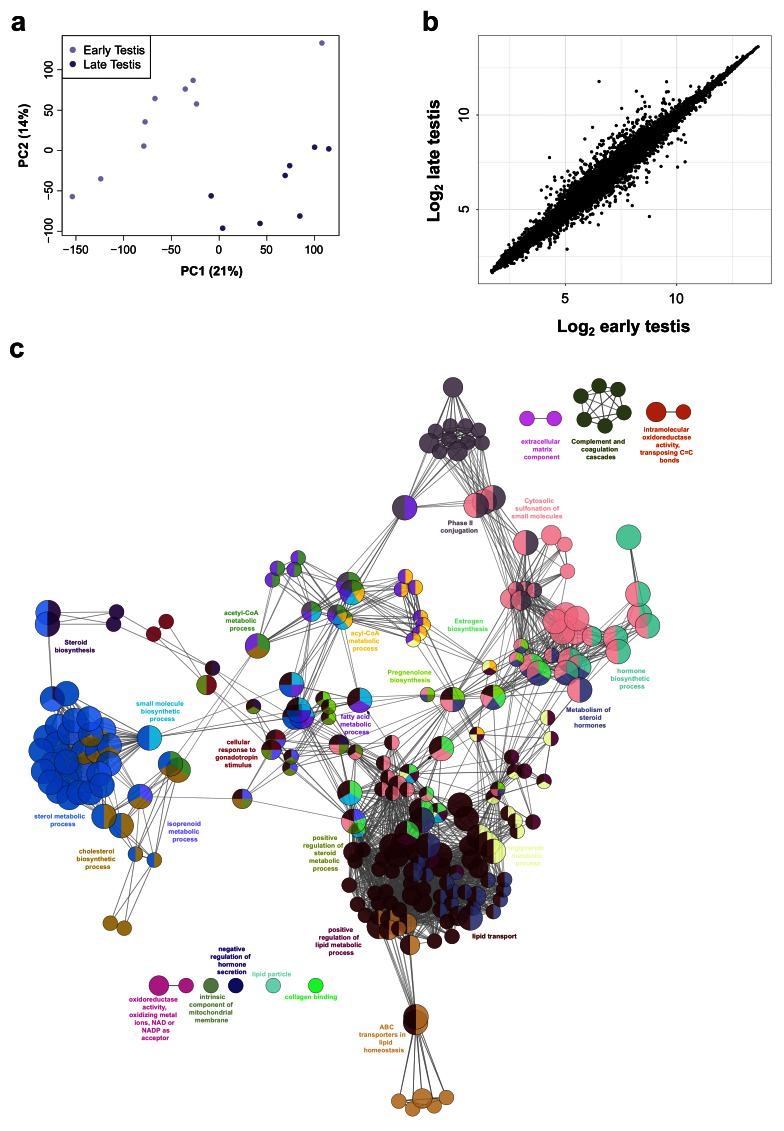
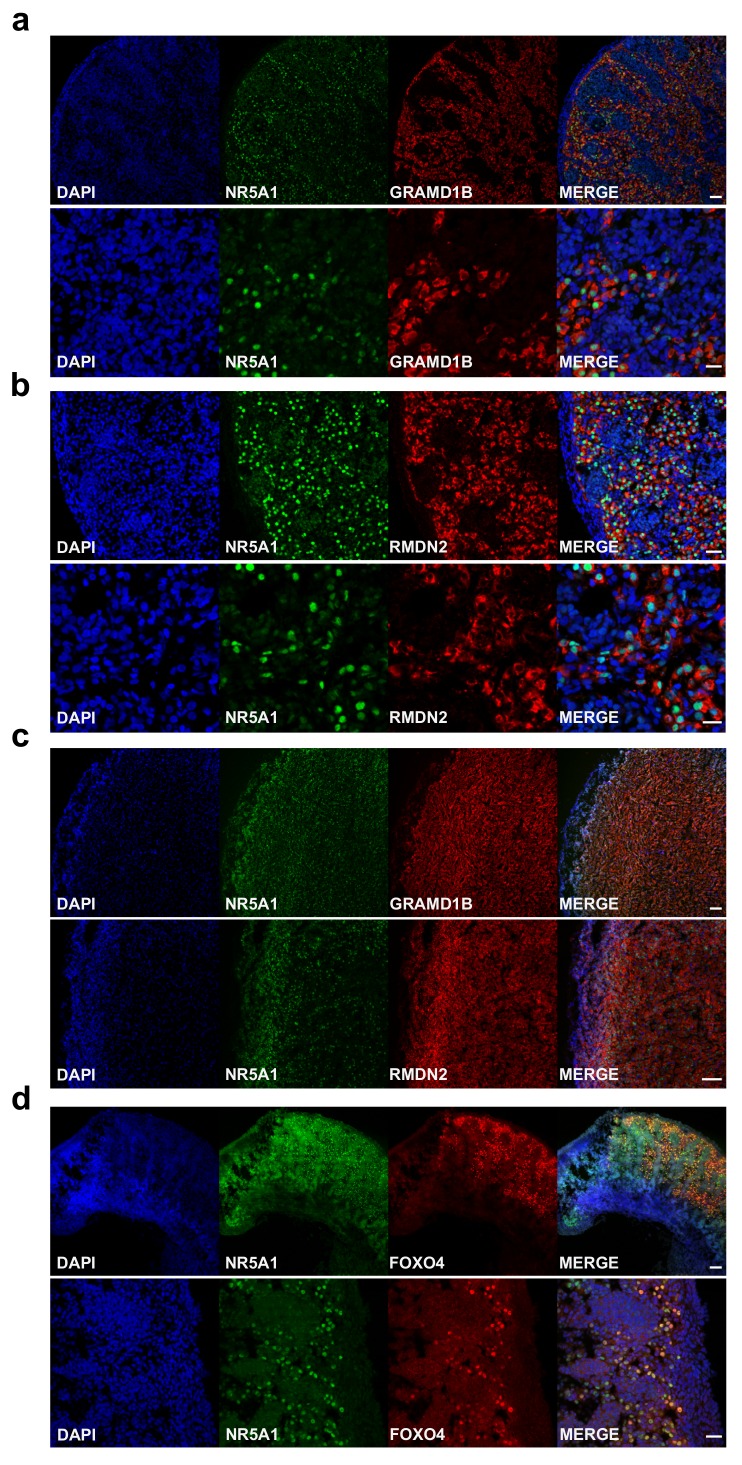
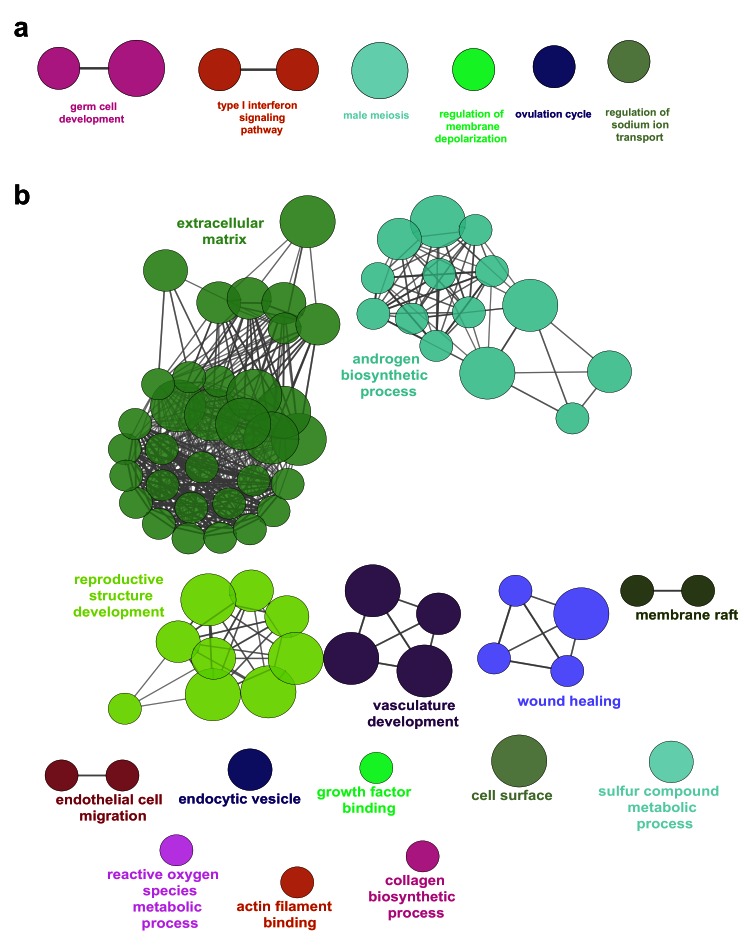
Methods: RNA was extracted from 53 tissue samples between 6-10 wpc (adrenal, testis, ovary and control). Affymetrix array analysis was performed and differential gene expression was analysed using Bioconductor. A mathematical model was constructed to investigate time-series changes across the dataset. Pathway analysis was performed using ClueGo and cellular localisation of novel factors confirmed using immunohistochemistry.

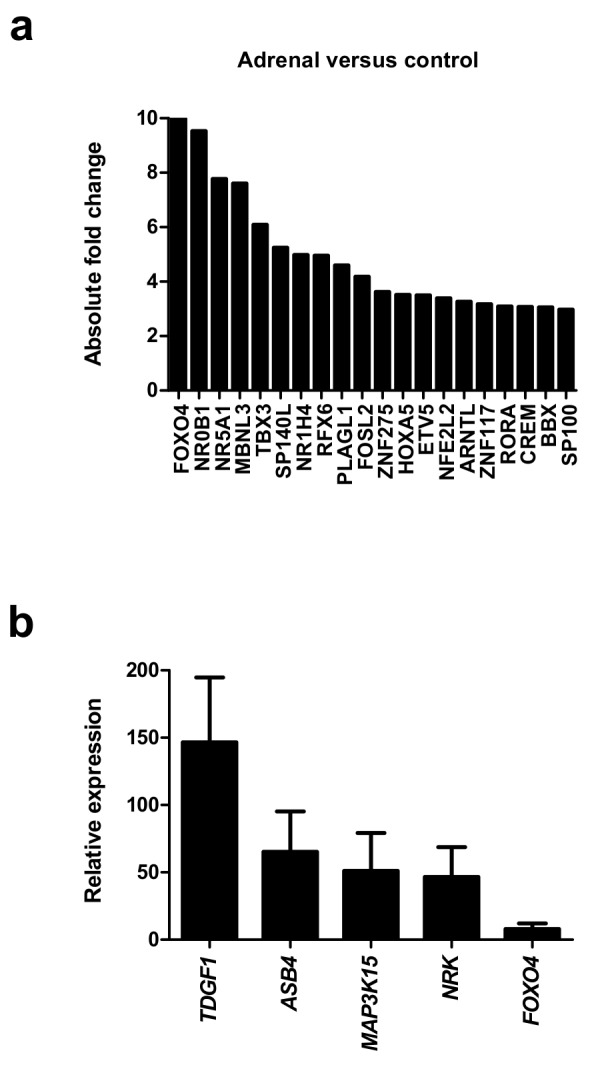
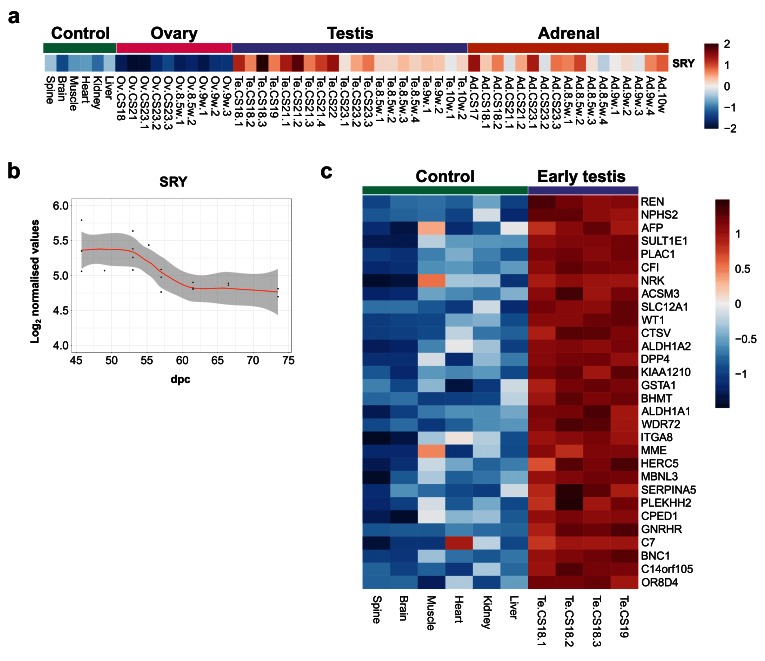
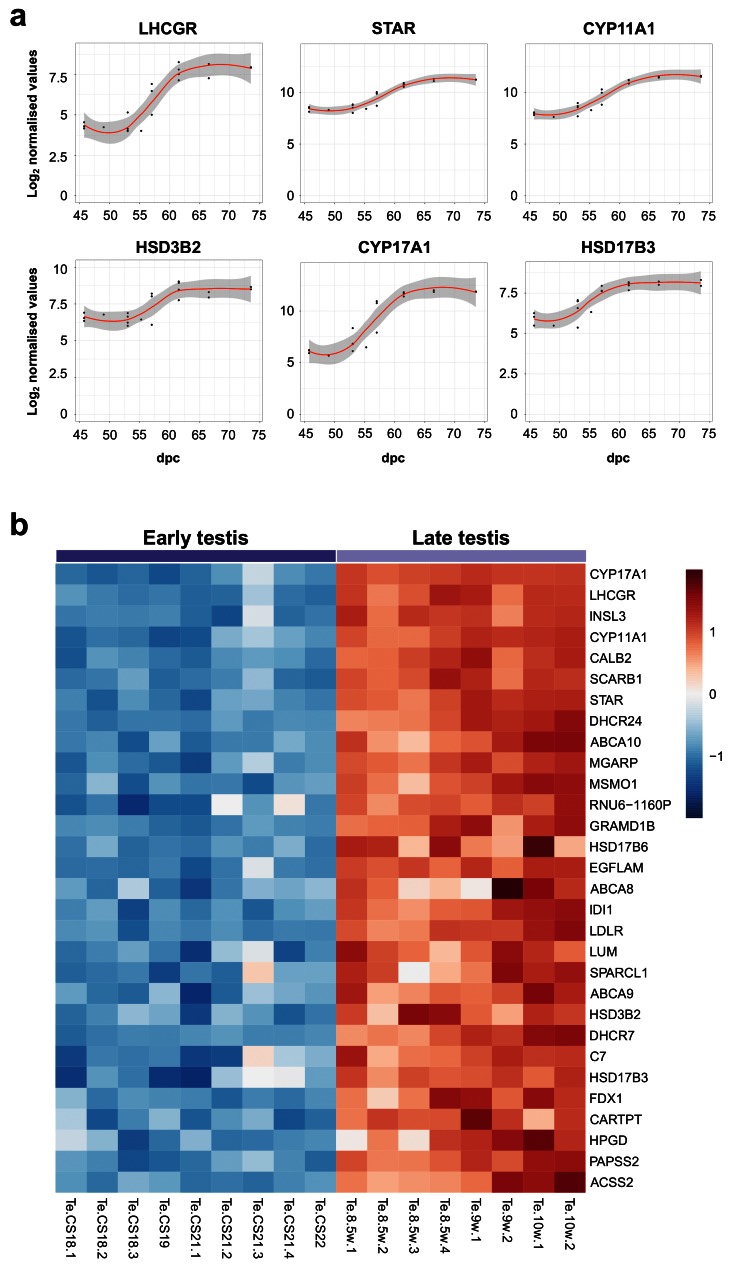
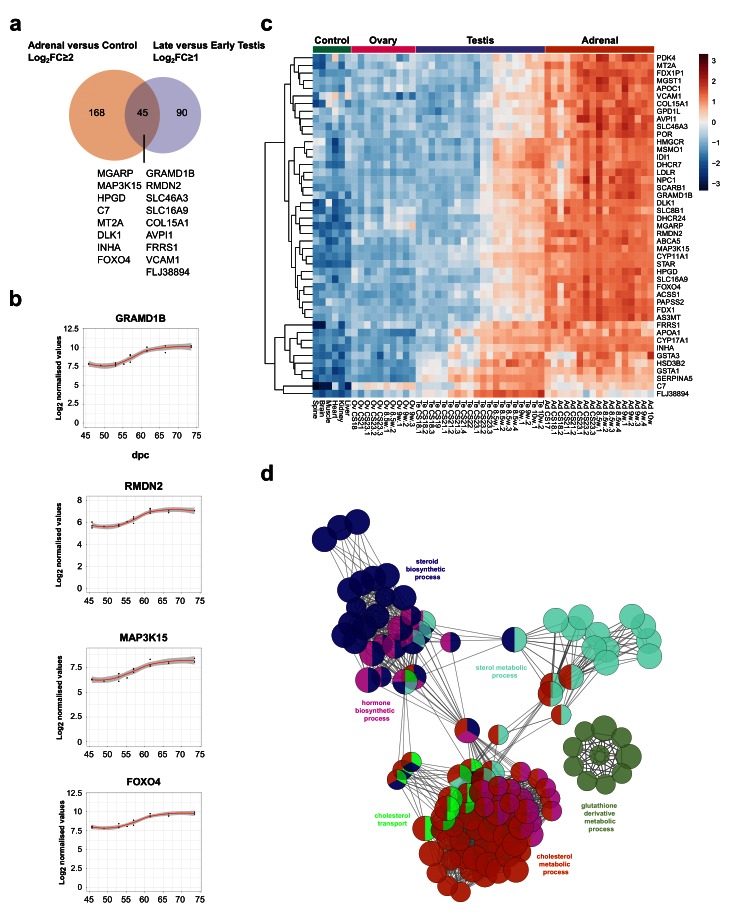
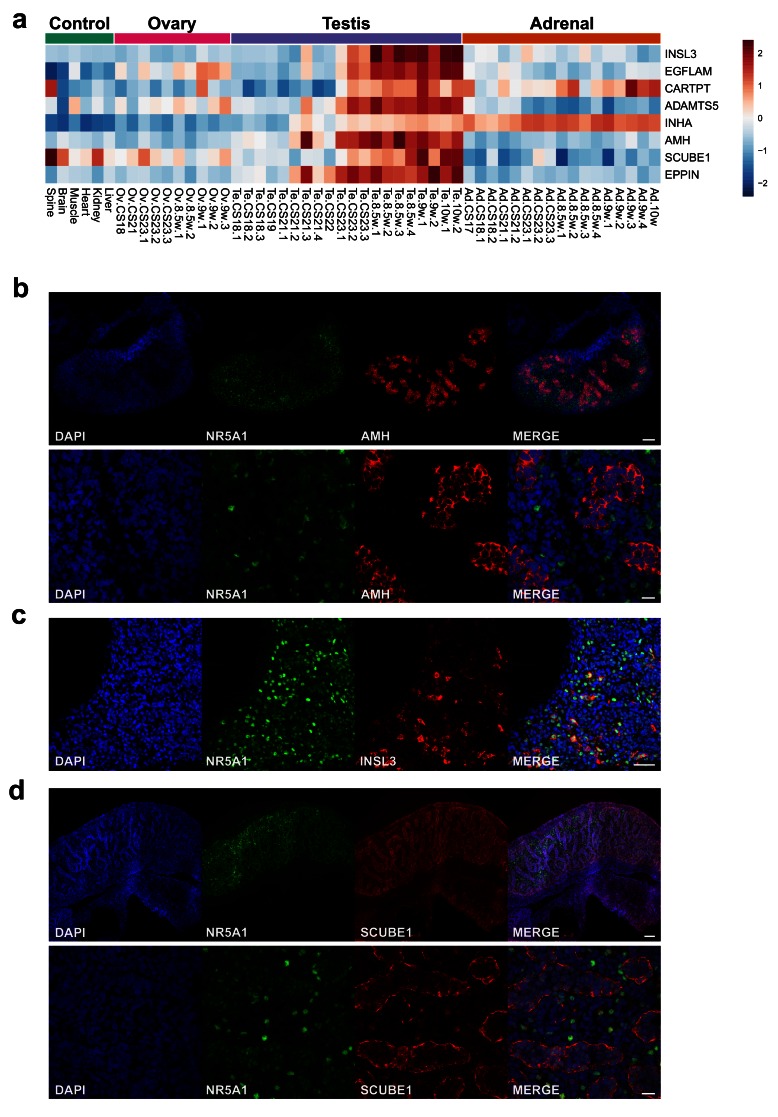
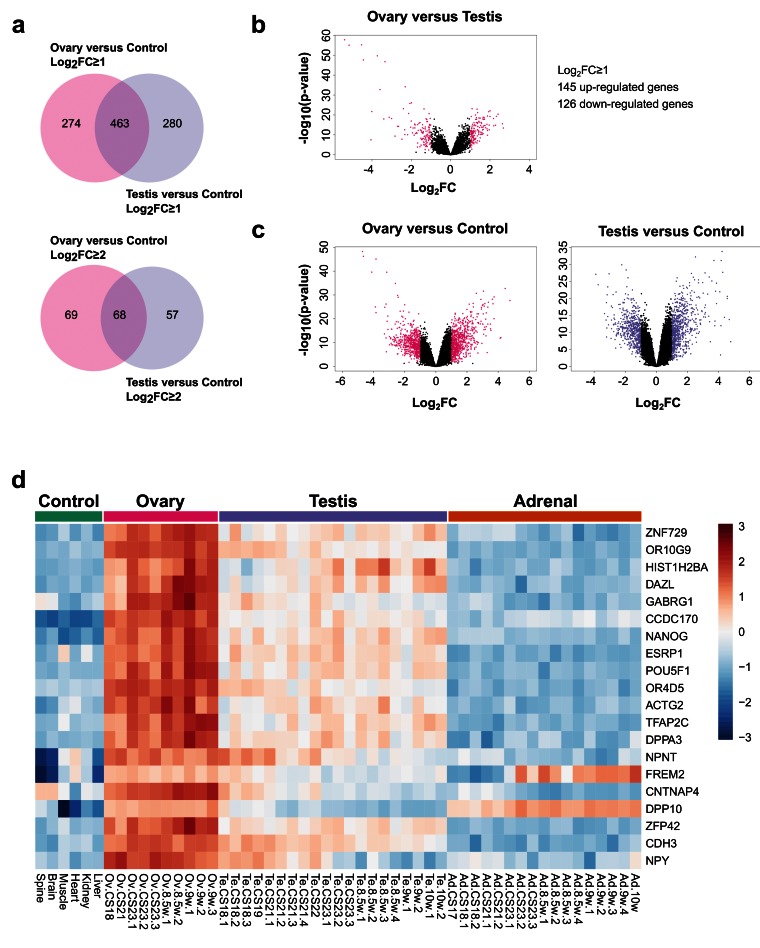
Results: Using this approach, we have identified novel components of adrenal development (e.g. ASB4, NPR3) and confirmed the role of SRY as the main human testis-determining gene. By mathematical modelling time-series data we have found new genes up-regulated with SOX9 in the testis (e.g. CITED1), which may represent components of the testis development pathway. We have shown that testicular steroidogenesis has a distinct onset at around 8 wpc and identified potential novel components in adrenal and testicular steroidogenesis (e.g. MGARP, FOXO4, MAP3K15, GRAMD1B, RMND2), as well as testis biomarkers (e.g. SCUBE1). We have also shown that the developing human ovary expresses distinct subsets of genes (e.g. OR10G9, OR4D5), but enrichment for established biological pathways is limited.

Conclusion: This genomic atlas is revealing important novel aspects of human development and new candidate genes for adrenal and reproductive disorders.

Keywords: adrenal; gene expression; germ cell; human development; ovary; sex development; steroidogenesis; testis.


Conflict of interest statement

Competing interests: No competing interests were disclosed.

Figures

Figure 1.
Figure 1.. Current model of human gonad and adrenal development between Carnegie Stage 13 (CS13) and Fetal Stage 3 (F3).
The bipotential gonad and adrenal gland both arise from the adrenogonadal primordium around CS13. Sex determination in the bipotential gonad occurs between CS17 and CS23 when transient SRY expression promotes the upregulation of genes, including SOX9, in the developing testis. Sex differentiation starts with the onset of steroidogenesis around CS23, which results in development of the external genitalia and phallic growth (right panel). Ovary-specific genes are thought to suppress male pathway specification. The ovary also supports germ cell expansion and entry into meiosis. The fetal adrenal cortex develops into definitive and fetal zones, producing steroid hormones and adrenal androgens. Chromaffin cells derived from the sympathetic nervous system migrate into the developing adrenal gland, merging later to form the adrenal medulla.
Figure 2.
Figure 2.. Differential gene expression in adrenal gland, testis and ovary compared to controls.
( a) Principal component analysis of the 53 samples included in the study (17 adrenal, 20 testes, 10 ovary and 6 controls). The scatter plot shows the position of samples based on the two first principal components (PC1, PC2). ( b) Venn diagram showing the overlap between differentially up-regulated genes in the adrenal, testis and ovary compared with control samples using either log 2FC≥1 or log 2FC≥2. ( c) Selected examples of differentially up-regulated genes (log 2FC≥2) involved in steroidogenesis ( d) Selected transcription factors differentially expressed in each tissue (log 2FC≥1). For all comparisons, P-value≤0.05.
Figure 3.
Figure 3.. Cluster analysis for all 53 samples included in the study.
( a) Correlation plot (heatmap) of gene expression. ( b) Hierarchical cluster dendrogram using the agglomeration method ward.D2.
Figure 4.
Figure 4.. Differential expression of genes in the adrenal gland.
( a) Correlation plot for log 2 mean gene expression levels in the adrenal versus control samples (Pearson’s product-moment correlation test correlation coefficient=0.96, P-value≤ 2.2e-16). ( b) Volcano plot analysis of differentially expressed genes in adrenal versus control samples. Genes with a log 2FC≥2 (or log 2FC≥-2) and P-value≤0.000005 are shown in orange. ( c) Immunohistochemistry of NR5A1, CYP11A1 and NRK in the human adrenal gland (9 wpc). Nuclei are stained blue with DAPI, which also highlights the outer capsule. Scale bars, 100 µm. ( d) Heatmap representing normalised gene expression values for the top 50 differentially up-regulated adrenal genes compared to control samples across the whole sample dataset. Genes are ordered according to descending log 2FC values. The intensity of gene expression is indicated by a colour scale: blue for lowest and red for highest expression levels. For all samples shown, P-value≤1e-10.
Figure 5.
Figure 5.. Analysis of differentially expressed adrenal genes.
( a) Absolute fold change (FC) of the top 20 up-regulated transcription factors in the adrenal gland compared to control samples. Data are derived from the array dataset. ( b) Confirmation of differential expression of several novel genes in the adrenal gland (9 wpc) by qRT-PCR. Pooled liver, brain and muscle were used as a control. GAPDH was used as a housekeeping gene.
Figure 6.
Figure 6.. SRY expression in early human testis and differential expression of other genes.
( a) Heatmap showing normalised gene expression values for SRY across the whole sample dataset. ( b) Scatter plot of normalised gene expression of SRY in testis samples between 45 and 74 dpc. Loess method was used to fit a smooth curve between expression values. ( c) Heatmap representing normalised gene expression values for the top 30 differentially up-regulated genes in early testis samples (CS18 and CS19 stages) ( N=4) compared to control samples ( N=6). Genes are ordered according to decreasing log 2FC values. The intensity of gene expression is indicated by a colour scale: blue for lowest and red for highest expression levels. For all samples shown, P-value≤0.05.
Figure 7.
Figure 7.. Differentially expressed genes in the early testis compared to control samples.
( a) Correlation plot for log 2 mean gene expression levels in the early testis (CS18 to CS19) ( N=4) versus control samples ( N=6) (Pearson’s product-moment correlation test correlation coefficient=0.968, P-value≤ 2.2e-16). ( b) Volcano plot for the differentially expressed genes in early testis versus control samples. Purple colour indicates genes with absolute log 2FC≥1 and P-value≤ 0.05. ( c) Pathway-enrichment analysis using ClueGO for differentially expressed up-regulated pathways in early testis compared to control samples (log 2FC≥1, P-value≤0.005).
Figure 8.
Figure 8.. Identification of potential genes downstream of SRY using the BALT model.
( a) Scatter plot showing curvilinear upregulation of SOX9 during testis development (45 to 74 dpc). Loess method was used for fitting a smooth curve between variables. ( b) Equation used in the BALT mathematical model (see methods for details). ( c) Scatter plots showing changes in gene expression patterns for CITED1, ANKRD18A, PRPS2 and ZNF280B in the developing testis (45 to 74 dpc). Loess method was used for fitting a smooth curve between variables. ( d) Heatmap representing normalised gene expression values for genes showing similar expression patterns to SOX9, based on the BALT mathematical model. The intensity of gene expression is indicated by a colour scale: blue for lowest and red for highest expression levels. For all samples shown, P-value≤0.005. ( e) Immunohistochemistry for NR5A1 (SF-1, staining Leydig cells), SOX9, and CITED1 in the human fetal testis (11 wpc). Nuclei are counterstained blue with DAPI. Scale bars, 100 µm.
Figure 9.
Figure 9.. Determination of genes up-regulated with the onset of fetal testicular steroidogenesis.
( a) Scatter plots showing changes in gene expression patterns for known testicular steroidogenic genes, LHCGR, STAR, CYP11A1, HSD3B2, CYP17A1 and HSD17B3. The plot shows normalised gene expression values for testis samples between approximately 46 and 74 dpc. Loess method was used for fitting a smooth curve between variables. ( b) Heatmap representing normalised gene expression values for the top 30 differentially up-regulated genes when comparing late (F1 to F3) ( N=8) and early (CS18 to CS22) ( N=9) testis samples. The intensity of gene expression is indicated by a colour scale: blue for lowest and red for highest expression levels. For all samples shown, P-value≤1e-4. Genes are ordered according to descending log 2FC values.
Figure 10.
Figure 10.. Differentially expressed genes in early compared to late testis samples.
( a) Principal component analysis of early ( N=9) compared to late ( N=8) testis samples. The scatter plot shows samples plotted on the two first principal components (PC1, PC2). ( b) Correlation plot for log 2 mean gene expression levels in the early testis (CS18 to CS22) versus late testis (F1 to F3) samples (Pearson’s product-moment correlation test correlation coefficient=0.992, P-value< 2.2e-16). ( c) Pathway-enrichment analysis using ClueGO for differentially up-regulated genes in early testis compared to late testis samples (log 2FC≥1, P-value≤0.01).
Figure 11.
Figure 11.. Identification of novel steroidogenesis genes.
( a) Venn diagram displaying the overlap for up-regulated genes between adrenal and control samples (log 2FC≥2) with late versus early testis samples (log 2FC≥1). A subset of genes found in the intersection are displayed, which are not yet established components of steroidogenesis. In all cases, P-value≤0.05. ( b) Scatter plots showing changes in gene expression patterns for four novel factors, GRAMD1B, RMDN2, MAP3K15, and FOXO4. The plot shows normalised gene expression values for testis samples between approximately 46 and 74 dpc. Loess method was used for fitting a smooth curve between variables. ( c) Heatmap representing normalised gene expression values for the 45 genes identified in the intersection between adrenal versus control and late testis versus early testis. The intensity of gene expression is indicated by a colour scale: blue for lowest and red for highest expression levels. Row-based unsupervised hierarchical clustering was performed. ( d) Pathway-enrichment analysis using ClueGO for the 45 genes identified in the intersection shown in ( a).
Figure 12.
Figure 12.. Validation of novel steroidogenic genes.
( a) Immunohistochemistry for GRAMD1B in human fetal testis at 9 wpc. NR5A1 (SF-1) was used to highlight Leydig cells (green). DAPI was used to counterstain nuclei (blue) and to highlight the outer capsule. Scale bars, 50 µm (top panels) and 20 µm (bottom panels). ( b) Immunohistochemistry of RMDN2 performed as above. Scale bars, 50 µm (top panels) and 20 µm (bottom panels). ( c) Immunohistochemistry of GRAMD1B and RMDN2 in the fetal adrenal gland at 9 wpc. NR5A1 (SF-1) was used to highlight the definitive zone and fetal zone cells (green). DAPI was used to counterstain nuclei (blue) and to highlight the outer capsule. Scale bars, 100 µm. ( d) Immunohistochemistry for FOXO4 in human fetal testis at 11 wpc. NR5A1 (SF-1) was used to highlight Leydig cells (green). DAP-I was used to counterstain nuclei (blue). Scale bar, 100 µm (top panels) and 20 µm (bottom panels).
Figure 13.
Figure 13.. Identification of potential testis-secreted proteins.
( a) Heatmap representing normalised gene expression values for potential secreted proteins. The intensity of gene expression is indicated by a colour scale: blue for lowest and red for highest expression levels. ( b) Immunohistochemistry for AMH (MIS) in human fetal testis at 9 wpc. NR5A1 (SF-1) was used to highlight Leydig cells (green). DAPI was used to counterstain nuclei (blue) and to highlight the outer capsule. Scale bars, 100 µm (top panels) and 20 µm (bottom panels) ( c) Immunohistochemistry for INSL3 in human fetal testis at 9 wpc. NR5A1 (SF-1) was used to highlight Leydig cells (green). DAPI was used to counterstain nuclei (blue). Scale bar, 50 µm ( d) Immunohistochemistry for SCUBE1 in human fetal testis at 9 wpc. NR5A1 (SF-1) was used to highlight Leydig cells (green). DAPI was used to counterstain nuclei (blue). Scale bars, 100 µm (top panels) and 20 µm (bottom panels).
Figure 14.
Figure 14.. Ovary development dynamics.
( a) Venn diagram displaying the overlap for up-regulated genes between ovary and control versus testis and control samples using log 2FC≥1 (upper panel) and log 2FC≥2 (lower panel) cut-offs. P-value≤0.05. ( b) Volcano plot analysis of differentially expressed genes in ovary versus testis samples. Genes with an absolute log 2FC≥1 and P-value≤0.05 are shown in pink. ( c) Volcano plot analysis of differentially expressed genes in the ovary versus control samples (left panel) and testis versus control samples (right panel). Genes with an absolute log 2FC≥1 and P-value≤0.05 are shown in pink and purple respectively. ( d) Heatmap representing normalised gene expression values for the top 20 differentially expressed genes found only in the ovary versus control samples, using a log 2FC≥2 cut-off. The intensity of gene expression is indicated by a colour scale: blue for lowest and red for highest expression levels. P-value≤1e-5. Genes are ordered according to decreasing log 2FC values.
Figure 15.
Figure 15.. Pathway enrichment analysis of ovary-specific genes.
( a) Pathway-enrichment analysis using ClueGO for differentially up-regulated genes in the ovary compared to control, with testis up-regulated genes excluded (log 2FC≥1, P-value≤0.05). ( b) Pathway-enrichment analysis using ClueGO for differentially up-regulated genes in the testis compared to control, with ovary up-regulated genes excluded (log 2FC≥1, P-value≤0.05).

Similar articles

Cited by

References

    1. Achermann JC: A genomic atlas of human adrenal and gonad development. OSF. 2017. Data Source - DOI - PMC - PubMed
    1. Achermann JC, Ito M, Ito M, et al. : A mutation in the gene encoding steroidogenic factor-1 causes XY sex reversal and adrenal failure in humans. Nat Genet. 1999;22(2):125–126. 10.1038/9629 - DOI - PubMed
    1. Araujo FC, Milsted A, Watanabe IK, et al. : Similarities and differences of X and Y chromosome homologous genes, SRY and SOX3, in regulating the renin-angiotensin system promoters. Physiol Genomics. 2015;47(5):177–186. 10.1152/physiolgenomics.00138.2014 - DOI - PMC - PubMed
    1. Bashamboo A, Eozenou C, Rojo S, et al. : Anomalies in human sex determination provide unique insights into the complex genetic interactions of early gonad development. Clin Genet. 2017;91(2):143–156. 10.1111/cge.12932 - DOI - PubMed
    1. Benjamini Y, Hochberg Y: Controlling the false discovery rate: a practical and powerful approach to multiple testing. J R Stat Soc B. 1995;57(1):289–300. Reference Source