. 2017 Jun;23(6):681-691.
doi: 10.1038/nm.4332. Epub 2017 May 1.

Host DNA released by NETosis promotes rhinovirus-induced type-2 allergic asthma exacerbation

Affiliations

Host DNA released by NETosis promotes rhinovirus-induced type-2 allergic asthma exacerbation

Marie Toussaint et al. Nat Med. 2017 Jun.

Erratum in

Abstract

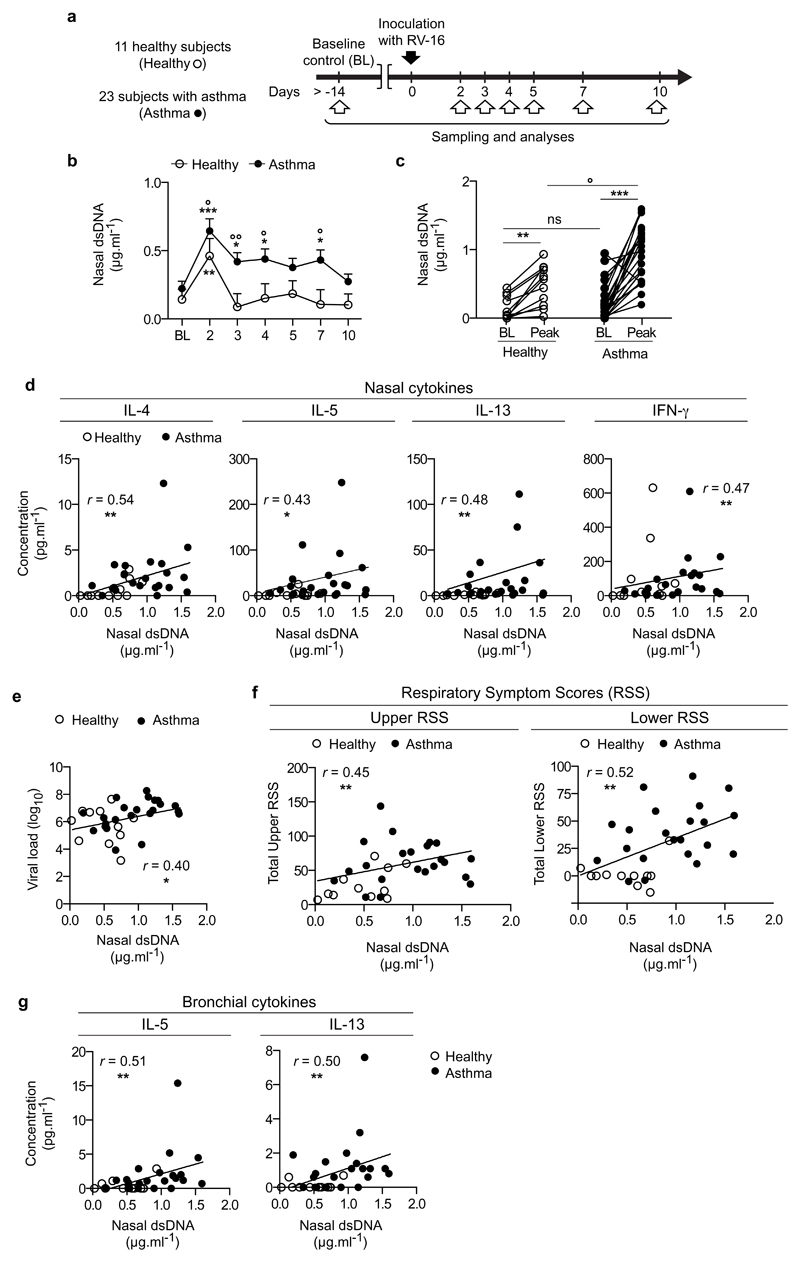
Respiratory viral infections represent the most common cause of allergic asthma exacerbations. Amplification of the type-2 immune response is strongly implicated in asthma exacerbation, but how virus infection boosts type-2 responses is poorly understood. We report a significant correlation between the release of host double-stranded DNA (dsDNA) following rhinovirus infection and the exacerbation of type-2 allergic inflammation in humans. In a mouse model of allergic airway hypersensitivity, we show that rhinovirus infection triggers dsDNA release associated with the formation of neutrophil extracellular traps (NETs), known as NETosis. We further demonstrate that inhibiting NETosis by blocking neutrophil elastase or by degrading NETs with DNase protects mice from type-2 immunopathology. Furthermore, the injection of mouse genomic DNA alone is sufficient to recapitulate many features of rhinovirus-induced type-2 immune responses and asthma pathology. Thus, NETosis and its associated extracellular dsDNA contribute to the pathogenesis and may represent potential therapeutic targets of rhinovirus-induced asthma exacerbations.


Conflict of interest statement

Competing financial interests

DJJ has received support for travel expenses to attend Respiratory Conferences from AstraZeneca, Boehringer Ingelheim (UK), and GSK.

SLJ reports grants and/or personal fees from Centocor; Sanofi Pasteur; GSK; Chiesi; Boehringer Ingelheim; Novartis; grants, personal fees and shareholding from Synairgen; personal fees from Bioforce outside the submitted work; In addition, SLJ is involved in patents relating to use of interferon-β and interferon-λ for the treatment and prevention of virally-induced exacerbation in asthma and chronic pulmonary obstructive disease, and for induction of cross-reactive cellular responses against rhinovirus antigens.

The other authors declare they have no competing financial interests.

Figures

Figure 1
Figure 1. Host dsDNA is released during human RV infection, is increased in RV-induced asthma exacerbation and correlates with type 2 cytokine production and exacerbation severity.
(a) Experimental outline. 11 healthy control and 23 subjects with asthma underwent sampling and analysis at baseline (BL) and 2, 3, 4, 5, 7 and 10 days after RV16 infection. (b) Concentrations of extracellular dsDNA in the acellular fraction of the nasal lavage fluid of subjects with asthma vs. healthy subjects at baseline and after RV16 infection, measured over time. (c) Comparison of baseline and peak (i.e., the maximal concentrations of dsDNA detected during the infection for each subject) levels of extracellular dsDNA, and between subjects with asthma and healthy subjects. (d) Correlation between peak levels of extracellular dsDNA and peak levels of the indicated nasal cytokines (i.e., the maximal levels of cytokines detected during the infection for each subject). (e) Correlation between peak concentrations of nasal dsDNA and peak viral load detected in the nose. (f) Correlation of peak levels of extracellular dsDNA with total upper and lower RSS. (g) Correlation of bronchial concentrations (on day 4 during infection) of IL-5 and IL-13 with peak concentrations of nasal dsDNA. (b-c) Asterisks (*) compare differences within the groups; circles (˚) compare differences between subjects with asthma and healthy subjects (b) at the indicated time points or (c) at the peak. The statistical significances of the differences between the baseline and the various times averages or the peak levels, and between the cohorts at the various time points were determined using contrasts between least square means estimated in the mixed model (described in the Online methods). (d-g) The correlation analysis used was nonparametric (Spearman’s correlation). Error bars indicate SEM. */˚, P<0.05; **/˚˚, P<0.01; ***/˚˚˚, P<0.001.
Figure 2
Figure 2. RV-induced exacerbation of allergic airway inflammation and type 2 immune responses are associated with host dsDNA release in mice.
(a) Experimental outline. HDM-sensitized or PBS-injected mice were challenged intranasally (i.n.) with HDM prior to inoculation with RV1b or UV-inactivated RV1b (UV). (b) Total cell counts and differential immune cell counts and percentages in the bronchoalveolar lavage fluid (BALF). (c) Absolute quantification of serum levels of total IgE. (d) Relative quantification of Muc5AC protein in the BALF. (e) Inflammatory score estimated from hematoxylin and eosin staining of lung sections. (f) Percentage positivity of periodic acid Schiff (PAS)-stained goblet cells per total epithelial cells. (g) Measurement of dynamic airway resistance. (h-i) Gating strategy to analyse the recruitment of TH2 lymphocytes (SSClowCD3+CD4+ICOS+ST2+) to the lung of mice by flow cytometry. (j) Total numbers and percentage of TH2 lymphocytes among live cells in the lung. (k-l) Levels of TH2 cytokines in the supernatant of cells isolated from the lung (k) and the mediastinal lymph nodes (MLNs) (l) and restimulated ex vivo with HDM. (m) Time course analysis of extracellular dsDNA release in the BALF of HDM-naïve mice after RV1b inoculation. Asterisks (*) compare differences between the indicated time points vs. the baseline. (n) Concentration of extracellular dsDNA in the BALF of the indicated groups of mice. Data are (b-j;m-n) of 1 experiment representative of 3 independent experiments, each replicate containing 5 mice/group; (k-l) pooled from 3 independent experiments, each symbol representing the mean of 1 experiment in which LN cells from the 5 mice were pooled by group. Differences between multiple groups were estimated using a one-way ANOVA with Tukey’s post hoc test (b-d,g,j-n, data show mean + SD) or Kruskal-Wallis test (e-f, data show median + interquartile range). *, P<0.05; **, P<0.01; ***, P<0.001. AU, arbitrary unit.
Figure 3
Figure 3. DNase treatment prevents RV-induced type 2 mediated exacerbation of allergic airway inflammation.
(a) Experimental outline. Mice were treated with DNaseI by i.p. injection 4 hours before inoculation and 1 and 2 days p.i. and by the i.n. route 8 hours and 1 and 2 days p.i. (b) Levels of dsDNA in the BALF at day 1 p.i. (c) Total cell counts and differential immune cell counts and percentages in bronchoalveolar lavage fluid (BALF). (d) Absolute quantification of serum levels of total IgE. (e) Relative quantification of Muc5AC protein in the BALF. (f) Inflammatory score estimated from hematoxylin and eosin staining of lung sections. (g) Percentage positivity of periodic acid Schiff (PAS)-stained goblet cells per total epithelial cells. (h) Measurement of dynamic airway resistance. (i) Total number and percentage of TH2 lymphocytes (SSClowCD3+CD4+ICOS+ST2+) among live cells in the lungs of mice. (j,k) Levels of TH2 cytokines in the supernatant of cells isolated from the lung (j) and the mediastinal lymph nodes (MLNs) (k) and restimulated ex vivo with HDM. Data in (b-i) are from one experiment representative of 3 independent experiments with 6 (c-h) or 5 (b,i) mice/group. Data in (j-k) are pooled from 3 independent experiments, each symbol representing the mean of 1 experiment in which LN cells from the 6 mice were pooled by group. Differences between multiple groups were estimated using one-way ANOVA with Tukey’s post hoc test (b-e, h, i-k, data show mean + SD) or Kruskal-Wallis test (f-g, data show median + interquartile range). */˚, P<0.05. **/˚˚, P<0.01; ***/˚˚˚, P<0.001; circles (˚) compare DNase-treated vs. vehicle-injected counterparts. AU, arbitrary unit.
Figure 4
Figure 4. Host dsDNA is sufficient to exacerbate type 2 immune responses in allergic mice.
(a) Experimental outline. Mice were injected i.t. with 10μg of endogenous dsDNA 24h, 36h, 48h and 72h after the last HDM challenge. (b) Total cell counts and differential immune cell counts and percentages in bronchoalveolar lavage fluid (BALF). (c) Absolute quantification of serum levels of total IgE. (d) Relative quantification of Muc5AC protein in the BALF. (e) Inflammatory score estimated from hematoxylin and eosin staining of lung sections. (f) Percentage positivity of periodic acid Schiff (PAS)-stained goblet cells per total epithelial cells. (g) Measurement of dynamic airway resistance. (h) Total number and percentage of TH2 lymphocytes (SSClowCD3+CD4+ICOS+ST2+) among live cells in the lung. (i,j) Levels of TH2 cytokines in the supernatant of cells isolated from the lung (i) and the mediastinal lymph nodes (MLNs) (j) and restimulated ex vivo with HDM. Data are (b-h) of 1 experiment representative of 3 independent experiments with 5 mice/group; (i-j) pooled from 3 independent experiments, each symbol representing the mean of 1 experiment in which LN cells from the 6 mice were pooled by group. Differences between multiple groups were estimated using one-way ANOVA with Tukey’s post hoc test (b-d, g, h-j, data shown mean + SD) or Kruskal-Wallis test (e-f, data show median + interquartile range). */˚, P<0.05. **/˚˚, P<0.01; ***/˚˚˚, P<0.001; circles (˚) compare dsDNA-injected vs. vehicle-injected counterparts. ns, not significant; AU, arbitrary unit.
Figure 5
Figure 5. DNase treatment inhibits monocyte-derived dendritic cell recruitment during RV-induced exacerbation of allergic airway inflammation.
(a) Experimental outline. (b-d) Quantification of lung pro-TH2 dendritic cell (DC) populations. (b) Gating strategy to identify DC subsets present in the lung. We defined the monocyte-derived DC subset (mo-DC) as singlet living CD11c+MHCIIhighCD103-CD11b+CD64+ cells and the conventional CD11b+ DC subset (CD11b+cDC2) as CD11c+MHCIIhighCD103-CD11b+CD64-MAR- cells. (c,d) Total numbers of moDCs (c) and CD11b+cDC2 (d) among live cells in the lung are shown. (e-g) Quantification of MLN pro-TH2 DC populations. (e) Gating strategy to identify DC subsets present in the MLN. (f,g) Total numbers of moDCs (f) and CD11b+cDC2 (g) among live cells in the MLN are shown. (h-j) Levels of CCL2 (h), CCL7 (i) and CCL12 (j) in the acellular fraction of BALF. (b-j) Data are of 1 experiment representative of 2 independent experiments with 5 mice/group. Differences between multiple groups were estimated using one-way ANOVA with Tukey’s post hoc test. Error bars indicate SD. */˚, P<0.05. **/˚˚, P<0.01; ***/˚˚˚, P<0.001; circles (˚) compare DNase-treated vs. vehicle-injected counterparts. ns, not significant.
Figure 6
Figure 6. NETs released during RV infection promote type 2 immune-mediated exacerbation of allergic airway inflammation.
(a) Nasal baseline (BL) and day 4 p.i. levels of neutrophil elastase (NE) in subjects with asthma vs. healthy subjects. The statistical significances of the differences between the baseline and the peak, and between the groups at the various time points were determined using contrasts between least square means estimated in the mixed model (described in the Online methods). (b) Correlation between nasal levels of NE and dsDNA levels at day 4 p.i. in human samples. The correlation analysis used was nonparametric Spearman’s correlation. (c) Levels of NE in the bronchoalveolar lavage fluid (BALF) of the indicated groups of mice. Differences between groups were estimated using a Welch's ANOVA (compensating for the heterogeneity in the variances between the groups) with Tukey’s post hoc test. (d) Correlation between BALF NE levels and levels of dsDNA in mice. The correlation analysis used was parametric Pearson’s correlation. (e) Experimental outline for experiments shown in f-i. Mice were treated with neutrophil-depleting anti-Ly6G antibodies (α-Ly6G) 24 h prior to RV1b inoculation. (f,g) Total number of neutrophils (f) and levels of extracellular dsDNA (g) in the BALF of indicated groups of mice. (h,i) Quantification of NETs by high resolution confocal scanning microscopy (citrullinated histone H3 [Cit-H3], red, MPO [green] and DNA [DAPI, blue]) (h) and levels of Cit-H3 protein by Western Blot (i) in the lungs of the indicated groups of mice. Insets in h magnified on the right side. GAPDH was used as a loading control in i. (j) Experimental outline for experiments shown in k-o. Mice were treated by i.p. injection of the NE inhibitor (NEi; GW311616A) 12 hours before RV1b inoculation and every 12 hours after. (k) RV1b viral RNA in the lung tissue of mice. (l) Total and differential immune cell counts in BALF. (m) Measurement of dynamic airway resistance. (n) Total number and percentage of TH2 lymphocytes (SSClow, CD4+, CD3+, ICOS+, ST2+) among living cells in the lung. (o) Levels of TH2 cytokines in the supernatant of cells isolated from the mediastinal lymph node (MLN) and stimulated ex vivo with HDM. (c-o) Differences between groups were estimated using a Welch's ANOVA (compensating for the heterogeneity in the variances between the groups) with Tukey’s post hoc test. Data are (c-n) 1 experiment representative of 2 independent experiments with 5 mice/group; (o) pooled from 2 independent experiments, each symbol representing the mean of 1 experiment in which LN cells from the 5 mice were pooled by group. Blot images in i have been cropped and full-length blots can be found in Supplementary Fig.9e,f. Data show mean + SD. */˚, P<0.05; **/˚˚, P<0.01; ***/˚˚˚, P<0.001; circles (˚) compare α-Ly-6G- or NEi-treated vs. vehicle-injected counterparts. ns, not significant. Scale bar in h =100μm, except in magnified areas=10µm.

Comment in

References

    1. Johnston SL. The role of viral and atypical bacterial pathogens in asthma pathogenesis. Pediatr Pulmonol Suppl. 1999;18:141–143. - PubMed
    1. Johnston SL, et al. Community study of role of viral infections in exacerbations of asthma in 9-11 year old children. BMJ. 1995;310:1225–1229. - PMC - PubMed
    1. Busse WW, Lemanske RF, Jr, Gern JE. Role of viral respiratory infections in asthma and asthma exacerbations. Lancet. 2010;376:826–834. - PMC - PubMed
    1. Green RM, et al. Synergism between allergens and viruses and risk of hospital admission with asthma: case-control study. Bmj. 2002;324:763. - PMC - PubMed
    1. Murray CS, et al. Study of modifiable risk factors for asthma exacerbations: virus infection and allergen exposure increase the risk of asthma hospital admissions in children. Thorax. 2006;61:376–382. - PMC - PubMed

MeSH terms