. 2017 Jul;16(7):775-781.
doi: 10.1038/nmat4893. Epub 2017 May 1.

EGFR and HER2 activate rigidity sensing only on rigid matrices

Affiliations

EGFR and HER2 activate rigidity sensing only on rigid matrices

Mayur Saxena et al. Nat Mater. 2017 Jul.

Abstract

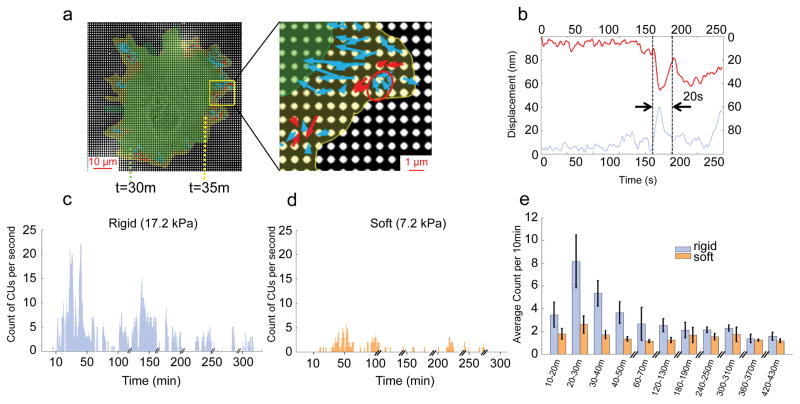
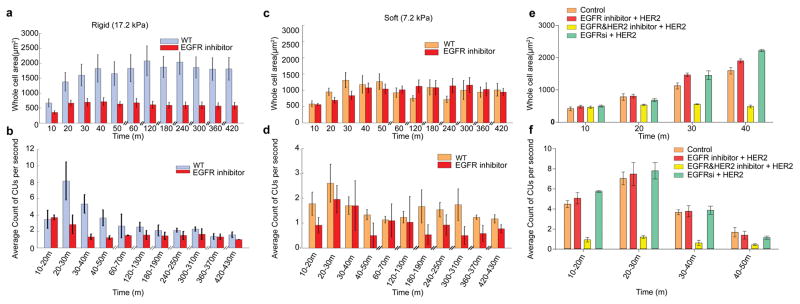
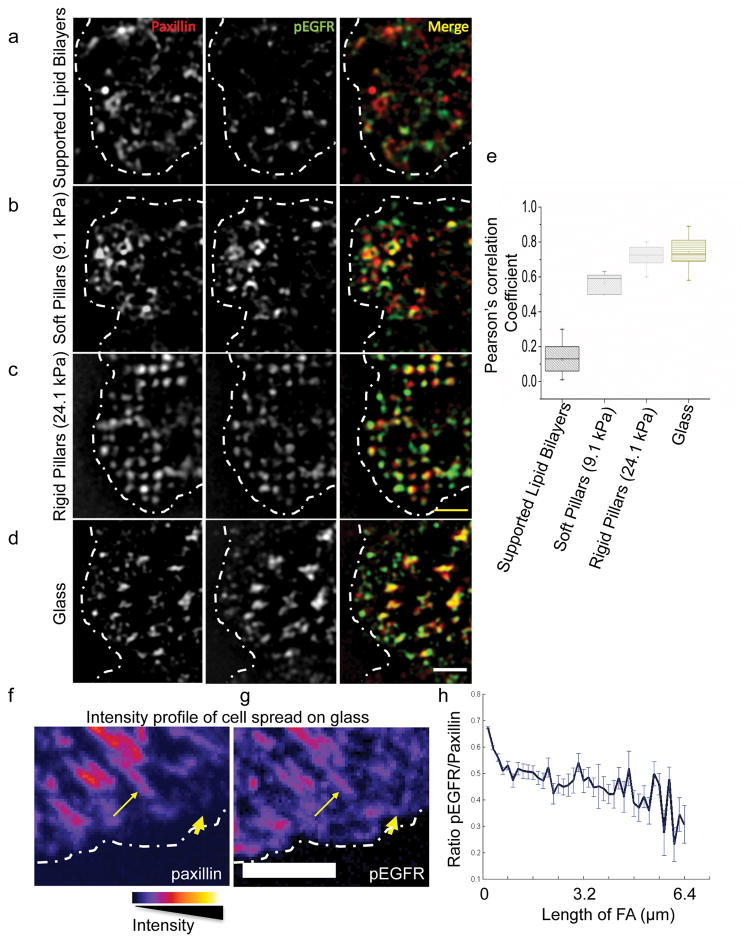
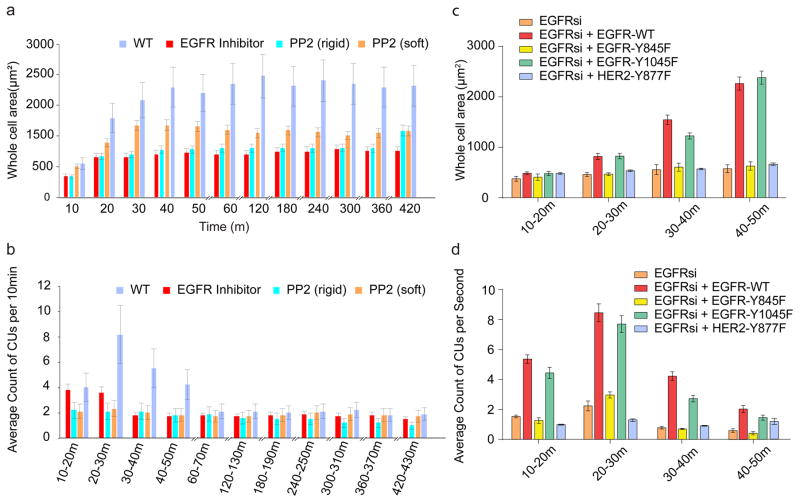
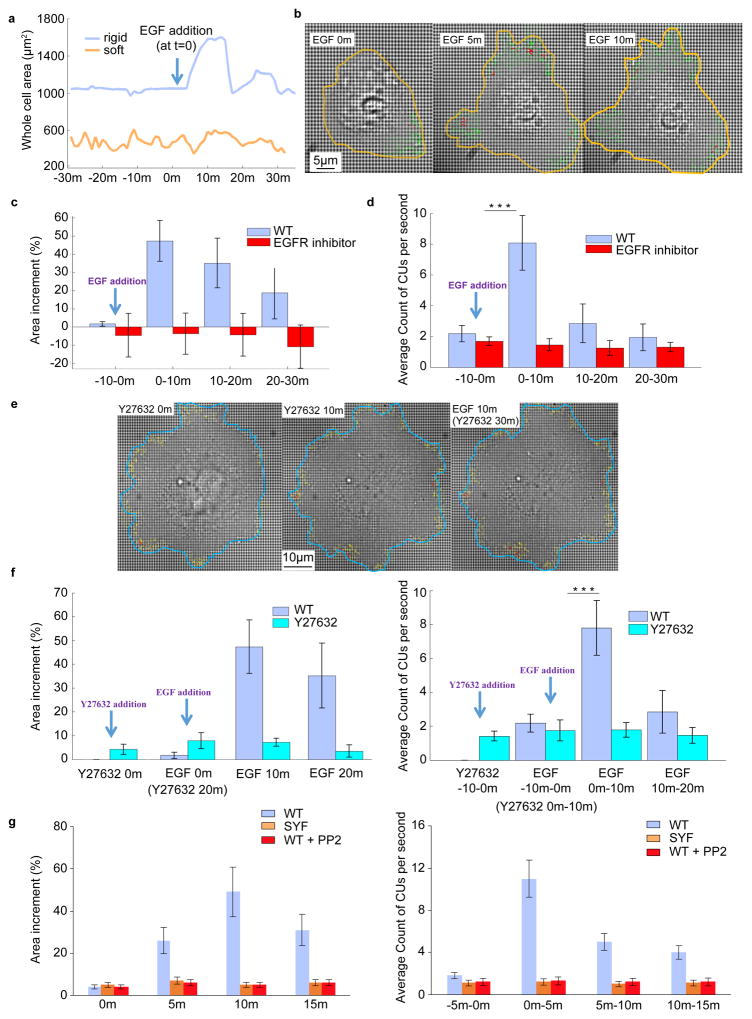
Epidermal growth factor receptor (EGFR) interacts with integrins during cell spreading and motility, but little is known about the role of EGFR in these mechanosensing processes. Here we show, using two different cell lines, that in serum- and EGF-free conditions, EGFR or HER2 activity increase spreading and rigidity-sensing contractions on rigid, but not soft, substrates. Contractions peak after 15-20 min, but diminish by tenfold after 4 h. Addition of EGF at that point increases spreading and contractions, but this can be blocked by myosin-II inhibition. We further show that EGFR and HER2 are activated through phosphorylation by Src family kinases (SFK). On soft surfaces, neither EGFR inhibition nor EGF stimulation have any effect on cell motility. Thus, EGFR or HER2 can catalyse rigidity sensing after associating with nascent adhesions under rigidity-dependent tension downstream of SFK activity. This has broad implications for the roles of EGFR and HER2 in the absence of EGF both for normal and cancerous growth.


Conflict of interest statement

Competing financial statement

The authors declare no competing financial interests.

Figures

Figure 1
Figure 1
Rigidity sensing activity measured by local CUs number. a, Actual CUs observed at the outward extending edge of a cell spreading on FN-coated 17.2 kPa pillars. Arrows represent pillar movement: red, detected CUs; blue, non-CUs. The red circle marks an example of a correctly identified CU. Cell edges marked in green and yellow correspond to time points 30 and 35 minutes respectively. b, Displacement vs. time of two 0.5 μm pillars (red and blue curve) that composed a CU (circled in a). The dotted lines mark the beginning and end time point of the CU. c,d, Measurement of CUs per entire cell per second for rigid (c) and soft (d) pillars. Cells were plated on FN-coated pillar substrate in media lacking serum for over 7 h. e, Average number of CUs per 10 min for cells on two pillar substrates of different stiffness in media lacking serum. n>10 cells per condition. n>5 independent experiments. Error bars show standard error of the mean.
Figure 2
Figure 2
Ligand-free EGFR and HER2 activity affects local CUs. a,c, Increment of cell area normalized to initial size with respect to time. Cells were plated on FN-coated stiff (a) and soft (c) pillar substrates in serum-free medium with and without 10 nM EGFR inhibitor gefitinib (n≥10 cells for each condition, n>5 independent experiments). b,d, Average of number of CUs per second for 10 min windows monitored for 7 hours on stiff (b) and soft (d) substrates. e, Areas of cos-7 cells expressing myosin IIA and transfected with the HER2 plasmid. They are spread on stiff pillars in the presence or absence of EGFR inhibitor, EGFR+HER2 inhibitor, or HER2 siRNA. f, Average number of CUs per second in 10 minute windows for the cells in e. Error bars show standard error of the mean in all cases.
Figure 3
Figure 3
pEGFR localizes to early adhesions on rigid substrates. a–d, A region of MEF-WT spread on supported lipid bilayers (15 minutes), soft (7.2 kPa) or rigid pillars (17.2 kPa; 25 minutes), or on glass (10 minutes), stained for paxillin (red) and pEGFR (Y1068, green), and imaged using structured illumination microscopy. Dotted white line marks the cell boundary. Scale bar is 2μm. e, Pearson’s correlation coefficient between paxillin and pEGFR measured for cells spread on different substrates. 30>n>10. For cells spread on pillars, colocalization was analyzed on a set of 6–8 pillars near the leading edge of the cell. f–g, Pseudo color images taken with confocal microscope (scale shown below) of MEF-WT spread on glass stained for paxillin (f) and pEGFR (Y1068; g). Dotted line marks the cell boundary. Thick arrows mark localization to early adhesions and thin arrows mark localization to maturing adhesions. Scale bar is 5 μm. h Ratio of pEGFR intensity to paxillin intensity in adhesions of increasing size. Error bars show standard error of the mean.
Figure 4
Figure 4
EGFR and HER2 affect local contractility through Src. a, Cell area with respect to time. Cells were pre-incubated with PP2 (200 nM) for 30 min prior to plating on FN-coated pillar substrates in serum-free medium. n>15 cells, n>5 independent experiments. b, Average of number of CUs per 10 min monitored for 7 hours. c, Area of Cos-7 cells expressing myosin IIA when transfected with siRNA for EGFR and mutations of EGFR or HER2 on FN coated stiff pillars. d, Average number of CUs in 10 minute windows for the cells shown in c. Error bars show standard error of the mean.
Figure 5
Figure 5
EGF activates local contraction activity. a, EGF (100 ng/ml) addition leads to outward movement of the cell edge on a rigid pillar substrate (blue curve) but not on a soft (orange curve). Cells were plated on FN-coated pillar substrates for 6 h in media lacking serum prior to EGF administration. b, Visualization of cell edge extension and increased CU numbers caused by EGF. The yellow line marks the cell edge at each time point after addition of EGF. The green arrows represent the pillar displacement in the active area, while red arrows mark CUs. c,d, Area and number of CUs change upon EGF addition. Measurements were carried out in two conditions: with or without EGFR inhibitor pretreatment for 20 min prior to EGF addition. c, Percentage of increased area of the whole cells measured at 0, 10, 20, and 30 min relative to the baseline area (-10 min). d, Average over 10 minutes of number of CUs per second before and after addition of EGF for the cells in c. e, Visualization of the development of cell area with time upon ROCK inhibition and EGF treatment. After 6 h plating on stiff pillar substrate, cells were treated with 10 μM Y-27632 for 20 min followed by EGF stimulation. Blue line marks the cell edge at each mentioned time point after the addition of EGF. The yellow arrows represent pillar displacement in the active area and red arrows mark CUs. f, Y-27632 was added to cells at minute 0. EGF was added to cells at minute 20. Left: percentage of increased area measured at 0 min with Y-27632, 20 min with Y-27632, 10 min with EGF, and 20 min with EGF relative to baseline area (10 min before addition of Y-27632). Right: average over windows of 10 minutes of number of CUs per second. g, Measurements similar to the ones performed in c were carried for three conditions: MEFs with or without PP2 inhibitor, and SYF cells. Left: percentage of increased area of the whole cells measured at 0, 5, 10, and 15 min relative to baseline area (-5 min). Right: average over 5 minutes of number of CUs per second before and after addition of EGF. n>10 for each condition. n>5 independent experiments. Error bars show standard error of the mean. ***p<0.001, student’s t-test

Comment in

  • EGFR probes matrix stiffness.
    Rosenthal CK. Rosenthal CK. Nat Cell Biol. 2017 May 31;19(6):600. doi: 10.1038/ncb3550. Nat Cell Biol. 2017. PMID: 28561056 No abstract available.

References

    1. Wang HB, Dembo M, Wang YL. Substrate flexibility regulates growth and apoptosis of normal but not transformed cells. Am J Physiol Cell Physiol. 2000;279:C1345–1350. - PubMed
    1. Engler AJ, Sen S, Sweeney HL, Discher DE. Matrix elasticity directs stem cell lineage specification. Cell. 2006;126:677–89. - PubMed
    1. Lo CM, Wang HB, Dembo M, Wang YL. Cell movement is guided by the rigidity of the substrate. Biophys J. 2000;79:144–52. - PMC - PubMed
    1. Elosegui-Artola A, et al. Rigidity sensing and adaptation through regulation of integrin types. Nat Mater. 2014;13:631–637. - PMC - PubMed
    1. Ghassemi S, et al. Cells test substrate rigidity by local contractions on submicrometer pillars. Proc Natl Acad Sci U A. 2012;109:5328–33. - PMC - PubMed

Publication types