

Genome-wide DNA methylation profiling reveals cancer-associated changes within early colonic neoplasia
- PMID: 28459462
- PMCID: PMC5578878
- DOI: 10.1038/onc.2017.130
Genome-wide DNA methylation profiling reveals cancer-associated changes within early colonic neoplasia
Abstract
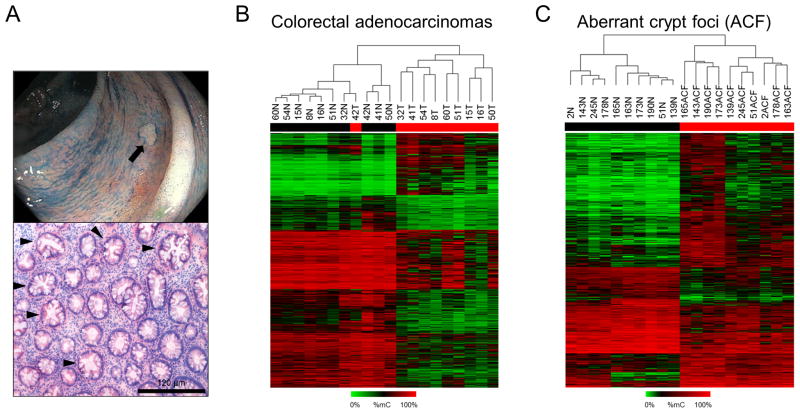
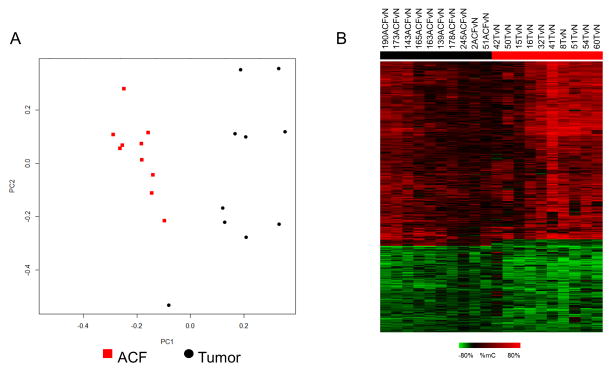
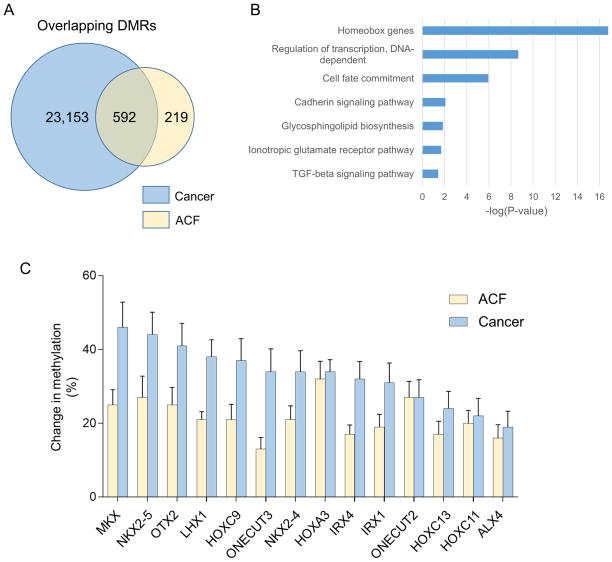
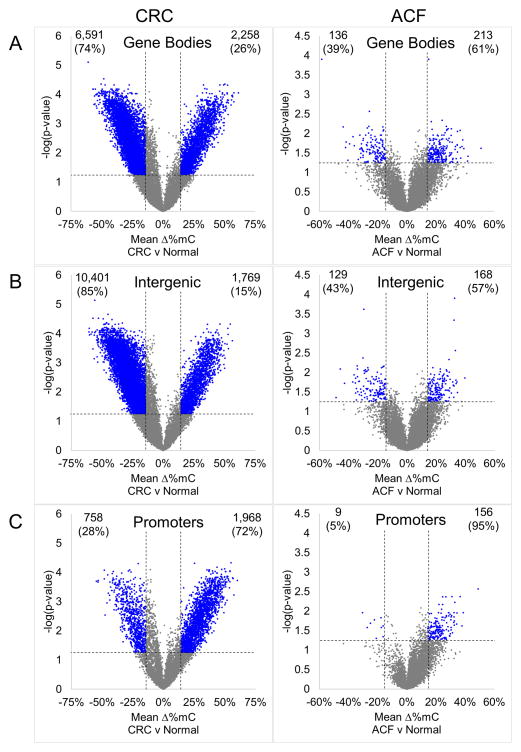
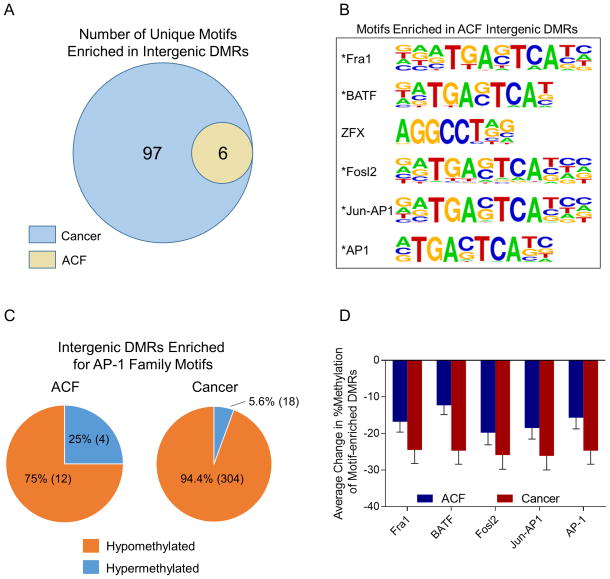
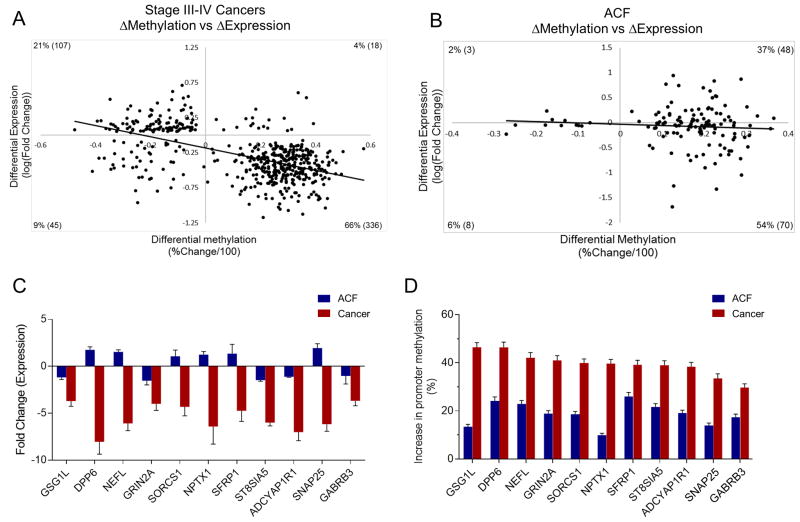
Colorectal cancer (CRC) is characterized by genome-wide alterations to DNA methylation that influence gene expression and genomic stability. Less is known about the extent to which methylation is disrupted in the earliest stages of CRC development. In this study, we have combined laser-capture microdissection with reduced representation bisulfite sequencing to identify cancer-associated DNA methylation changes in human aberrant crypt foci (ACF), the earliest putative precursor to CRC. Using this approach, methylation profiles have been generated for 10 KRAS-mutant ACF and 10 CRCs harboring a KRAS mutation, as well as matched samples of normal mucosa. Of 811 differentially methylated regions (DMRs) identified in ACF, 537 (66%) were hypermethylated and 274 (34%) were hypomethylated. DMRs located within intergenic regions were heavily enriched for AP-1 transcription factor binding sites and were frequently hypomethylated. Furthermore, gene ontology analysis demonstrated that DMRs associated with promoters were enriched for genes involved in intestinal development, including homeobox genes and targets of the Polycomb repressive complex 2. Consistent with their role in the earliest stages of colonic neoplasia, 75% of the loci harboring methylation changes in ACF were also altered in CRC samples, though the magnitude of change at these sites was lesser in ACF. Although aberrant promoter methylation was associated with altered gene expression in CRC, this was not the case in ACF, suggesting the insufficiency of methylation changes to modulate gene expression in early colonic neoplasia. Altogether, these data demonstrate that DNA methylation changes, including significant hypermethylation, occur more frequently in early colonic neoplasia than previously believed, and identify epigenomic features of ACF that may provide new targets for cancer chemoprevention or lead to the development of new biomarkers for CRC risk.
Conflict of interest statement
The authors state that there are no conflicts of interest to disclose.
Figures
Similar articles
-
Genome-wide methylation profiling identified novel differentially hypermethylated biomarker MPPED2 in colorectal cancer.Clin Epigenetics. 2019 Mar 7;11(1):41. doi: 10.1186/s13148-019-0628-y. Clin Epigenetics. 2019. PMID: 30846004 Free PMC article.
-
The DNA hypermethylation phenotype of colorectal cancer liver metastases resembles that of the primary colorectal cancers.BMC Cancer. 2020 Apr 6;20(1):290. doi: 10.1186/s12885-020-06777-6. BMC Cancer. 2020. PMID: 32252665 Free PMC article.
-
Microsatellite instability in aberrant crypt foci from patients without concurrent colon cancer.Carcinogenesis. 2007 Apr;28(4):769-76. doi: 10.1093/carcin/bgl209. Epub 2006 Nov 4. Carcinogenesis. 2007. PMID: 17088260
-
Aberrant crypt foci as microscopic precursors of colorectal cancer.World J Gastroenterol. 2003 Dec;9(12):2642-9. doi: 10.3748/wjg.v9.i12.2642. World J Gastroenterol. 2003. PMID: 14669304 Free PMC article. Review.
-
Accumulation of aberrant DNA methylation during colorectal cancer development.World J Gastroenterol. 2014 Jan 28;20(4):978-87. doi: 10.3748/wjg.v20.i4.978. World J Gastroenterol. 2014. PMID: 24574770 Free PMC article. Review.
Cited by
-
BSImp: Imputing Partially Observed Methylation Patterns for Evaluating Methylation Heterogeneity.Front Bioinform. 2022 Feb 10;2:815289. doi: 10.3389/fbinf.2022.815289. eCollection 2022. Front Bioinform. 2022. PMID: 36304331 Free PMC article. Review.
-
Methylome Imputation by Methylation Patterns.Methods Mol Biol. 2023;2624:115-126. doi: 10.1007/978-1-0716-2962-8_8. Methods Mol Biol. 2023. PMID: 36723812
-
Data-Driven Identification of Early Cancer-Associated Genes via Penalized Trans-Dimensional Hidden Markov Models.Biomolecules. 2025 Feb 16;15(2):294. doi: 10.3390/biom15020294. Biomolecules. 2025. PMID: 40001597 Free PMC article.
-
Identification of novel alternative splicing isoform biomarkers and their association with overall survival in colorectal cancer.BMC Gastroenterol. 2020 Jun 5;20(1):171. doi: 10.1186/s12876-020-01288-x. BMC Gastroenterol. 2020. PMID: 32503434 Free PMC article.
-
Association of dietary folate and vitamin B-12 intake with genome-wide DNA methylation in blood: a large-scale epigenome-wide association analysis in 5841 individuals.Am J Clin Nutr. 2019 Aug 1;110(2):437-450. doi: 10.1093/ajcn/nqz031. Am J Clin Nutr. 2019. PMID: 31165884 Free PMC article.
References
-
- American Cancer Society. Cancer Facts & Figures 2016. Am Cancer Soc. 2016
-
- Eden A, Gaudet F, Waghmare A, Jaenisch R. Chromosomal instability and tumors promoted by DNA hypomethylation. Science. 2003;300:455. - PubMed
-
- Esteller M. CpG island hypermethylation and tumor suppressor genes: a booming present, a brighter future. Oncogene. 2002;21:5427–5440. - PubMed
Publication types
MeSH terms
Substances
Grants and funding
LinkOut - more resources
Full Text Sources
Other Literature Sources
Molecular Biology Databases
Research Materials
Miscellaneous
