. 2017 Aug 31;36(35):4987-4996.
doi: 10.1038/onc.2017.107. Epub 2017 May 1.

Insulin resistance in vascular endothelial cells promotes intestinal tumour formation

Affiliations

Insulin resistance in vascular endothelial cells promotes intestinal tumour formation

X Wang et al. Oncogene. .

Abstract

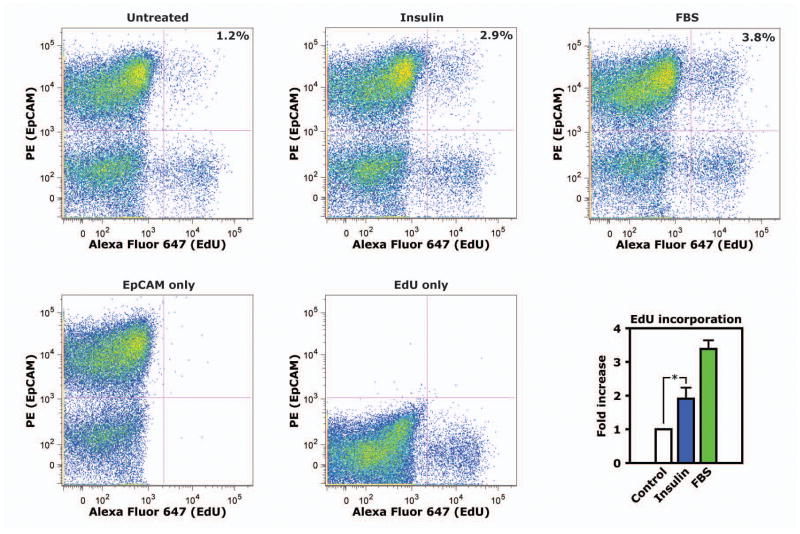
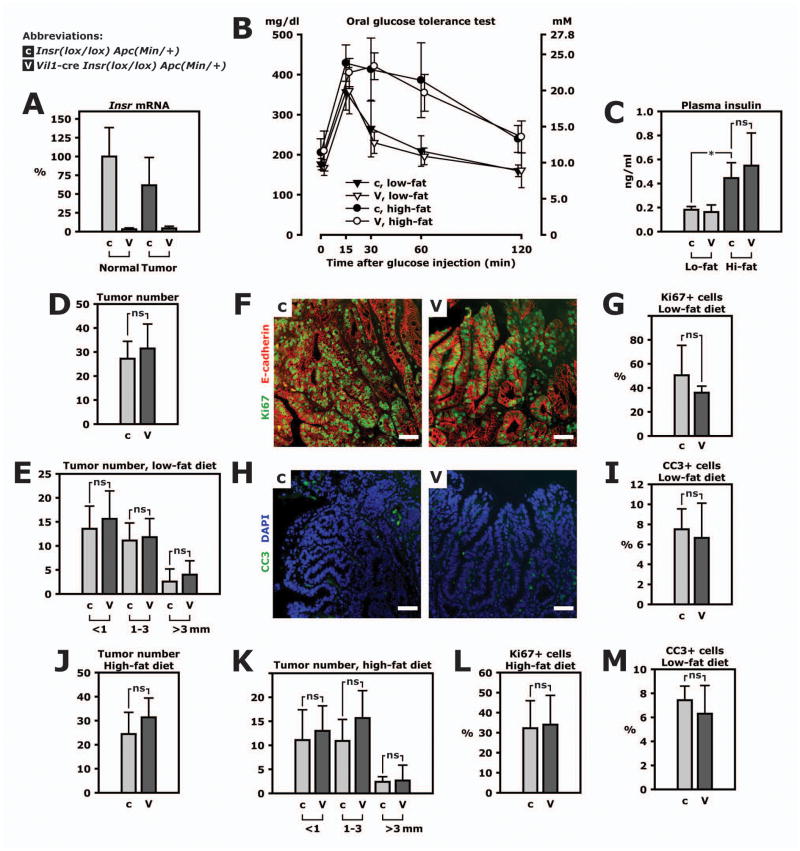
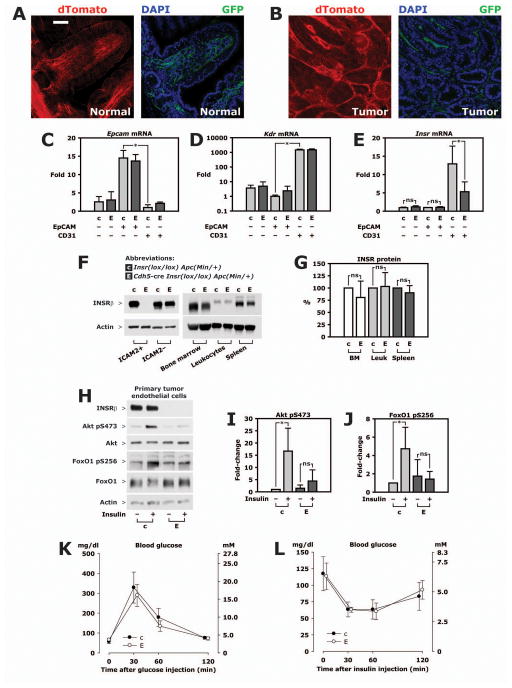
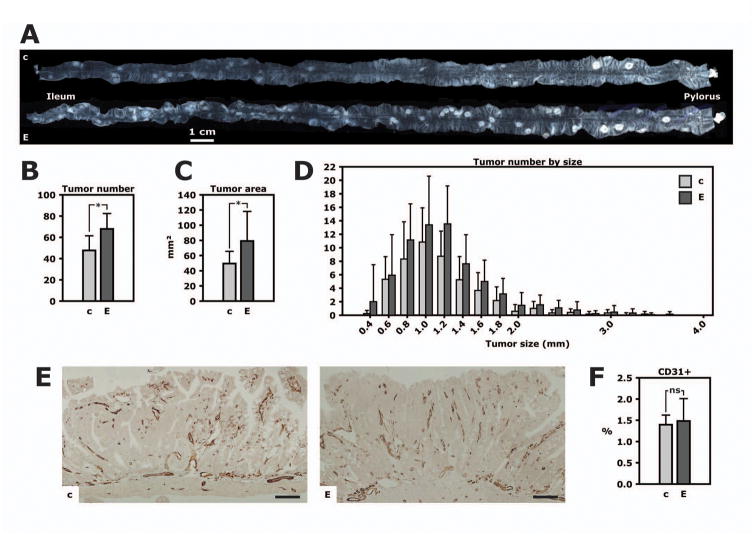
The risk of several cancers, including colorectal cancer, is increased in patients with obesity and type 2 diabetes, conditions characterised by hyperinsulinaemia and insulin resistance. Because hyperinsulinaemia itself is an independent risk factor for cancer development, we examined tissue-specific insulin action in intestinal tumour formation. In vitro, insulin increased proliferation of intestinal tumour epithelial cells by almost two-fold in primary culture of tumour cells from ApcMin/+ mice. Surprisingly, targeted deletion of insulin receptors in intestinal epithelial cells in ApcMin/+ mice did not change intestinal tumour number or size distribution on either a low or high-fat diet. We therefore asked whether cells in the tumour stroma might explain the association between tumour formation and insulin resistance. To this end, we generated ApcMin/+ mice with loss of insulin receptors in vascular endothelial cells. Strikingly, these mice had 42% more intestinal tumours than controls, no change in tumour angiogenesis, but increased expression of vascular cell adhesion molecule-1 (VCAM-1) in primary culture of tumour endothelial cells. Insulin decreased VCAM-1 expression and leukocyte adhesion in quiescent tumour endothelial cells with intact insulin receptors and partly prevented increases in VCAM-1 and leukocyte adhesion after treatment with tumour necrosis factor-α. Knockout of insulin receptors in endothelial cells also increased leukocyte adhesion in mesenteric venules and increased the frequency of neutrophils in tumours. We conclude that although insulin is mitogenic for intestinal tumour cells in vitro, impaired insulin action in the tumour microenvironment may be more important in conditions where hyperinsulinaemia is secondary to insulin resistance. Insulin resistance in tumour endothelial cells produces an activated, proinflammatory state that promotes tumorigenesis. Improvement of endothelial dysfunction may reduce colorectal cancer risk in patients with obesity and type 2 diabetes.


Conflict of interest statement

Conflict of Interest

Thomas Rathjen is an employee of Novo Nordisk A/S as a participant in the company’s “STAR Programme” for postdoc training. Christian Rask-Madsen receives research support from Novo Nordisk as part of this program. The company had no role in the design of this study, collection and analysis of data or decision to publish. The remaining authors disclose no financial, professional, or personal conflict of interest.

Figures

Figure 1
Figure 1. Insulin increases proliferation of serum-starved primary polyp epithelial cells in culture
Polyps were isolated from ApcMin/+ mice and tumor cells dissociated by enzymatic digestion were grown in culture. Cells were serum-starved overnight, then stimulated with insulin for 16 hours. In the final 4 hours of this period, cultures were labeled with EdU. The proportion of cells double-positive for EpCAM, an epithelial cell marker, and EdU were analyzed by flow cytometry. Scatter plots show representative data from flow cytometry. The graph shows mean values from independent experiments using primary culture from 4 different animals. *, p<0.05.
Figure 2
Figure 2. Loss of the insulin receptor in intestinal epithelial cells does not change tumorigenesis
ApcMin/+ mice with insulin receptor knockout targeted to intestinal epithelial cells were studied (genotype Vil1-cre Insrlox/lox ApcMin/+, abbreviated VILIRKO-Min and labeled “V” in this figure). They were compared to littermate controls (genotype Insrlox/lox ApcMin/+ and labeled “c” in this figure). A. Insr mRNA was measured by real-time PCR in lysate of tumors or normal jejunum. B. Mice were fed a low-fat or high-fat diet for 8 weeks and subjected to an oral glucose tolerance test at 12 weeks of age. For the test, mice fasted overnight and were given 2 mg glucose per g body weight by gavage. Glucose concentration was measured in plasma from tail blood. C. Insulin was measured in plasma in fasted animals. D. Tumor number was counted in the entire small intestine of 9 control mice and 11 VILIRKO-Min mice fed a low-fat diet. E. Tumor number in 3 categories of tumor size. F. Representative microphotos of Ki67 (green) and E-cadherin (red) immunohistofluorescence performed on sections of paraffin-embedded tissue. Scale bars represent 50 μm. G. Frequency of Ki67+ cells in tumor tissue. H. Representative microphotos of cleaved caspase-3 (CC3) immunohistofluorescence (green) and DAPI (blue). Scale bars represent 50 μm. I. Frequency of CC3+ cells in tumor tissue. J. Tumor number in the entire small intestine of 9 control mice and 11 VILIRKO-Min mice fed a high-fat diet. K. Size distribution of small intestinal tumors in mice fed a high-fat diet. L. Frequency of Ki67+ cells in tumor tissue mice fed a high-fat diet. M. Frequency of CC3+ cells in tumor tissue in mice mice fed a high-fat diet. All panels: *, p<0.05.
Figure 3
Figure 3. Characterization of EndoIRKO-Min mice
A–B. Cdh5-cre ApcMin/+ mice were crossed with mT/mG mice, a double-fluorescent reporter of cre recombinase activity. Offspring have ubiquitous expression of a red fluorescent protein, i. e. membrane-targeted tandem dTomato (dTomato), except in cells with cre-mediated recombination of the mT/mG transgene where dTomato expression is replaced with expression of membrane-targeted enhanced green fluorescent protein (GFP). 80 μm cryosections of formalin-fixed tissue was stained with DAPI only and imaged with confocal microscopy. Scale bar, 50 μm. A. Normal intestine. B. Polyp. C–E. Tumors from 3 EndoIRKO-Min mice and 3 controls were enzymatically digested and cells sorted by FACS using antibodies against EpCAM or CD31; status as double-negative or single-positive for this antigens is indicated below graphs. mRNA expression was measured by real-time PCR and normalized to expression of Rplp0, a ribosomal RNA. C. Enrichment of epithelial cells in EpCAM+ CD31− fraction shown by expression of Epcam mRNA. D. Enrichment of endothelial cells EpCAM− CD31+ fraction shown by expression of Kdr mRNA. Please note log scale. E. Expression of Insr mRNA. F. Tumor cells from Cdh5-cre Insrlox/lox ApcMin/+ mice (EndoIRKO-Min, “E”) or their littermate Insrlox/lox ApcMin/+ controls (“c”) were grown in a mixed culture and endothelial cells isolated by magnetic selection using ICAM-2 conjugated Dynabeads at the first and second passage. ICAM-2-negative cells were collected at the first of these immuno-magnetic sortings while tumor endothelial cells were used after passage 3. Bone marrow, peripheral blood leukocytes and spleen were isolated and lysed. Representative Western blots of lysate is shown. G. Quantitation based on densitometry of Western blots using material from 3 pairs of animals. H. Isolated tumor endothelial cells were serum-starved overnight, then treated with 10 nM insulin for 5 minutes. Representative Western blots are shown. I–J. Quantitation based on lysate from 4 independent experiments. K. glucose tolerance test. Plasma glucose concentrations were measured after intraperitoneal injection of 2 mg/g glucose in 5 EndoIRKO-Min mice and 5 control animals. L. Insulin tolerance test. Plasma glucose concentrations after intraperitoneal injection of 0.75 mU/g Humulin R in 5 EndoIRKO-Min mice and 5 control animals. All panels: *, p<0.05.
Figure 4
Figure 4. Loss of the vascular endothelial cell insulin receptor enhances tumor formation
EndoIRKO-Min mice (“E”) and their littermate controls (“c”) were fed a regular chow diet and sacrificed at 16 weeks of age. A. The entire small intestine from two littermates. Adenomas are clearly visible as pale, circular lesions. B. Total number of tumors in the small intestine from EndoIRKO-Min mice (n=12) and controls (n=13). *, p=0.002. C. Total tumor area. *, p=0.02. D. Distribution of tumor number by diameter. E. Representative microphotos of CD31 immunohistochemistry in small intestinal tumors. Scale bar, 100 μm. F. Quantitation of tumor vascular density based on CD31 immunohistochemistry.
Figure 5
Figure 5. VCAM-1 expression and leukocyte recruitment associated with insulin resistant tumor endothelium
Primary tumor endothelial cells were isolated by immuno-magnetic selection from a mixed culture of tumor cells. Cultures were used at passage 3 or 4. After overnight serum starvation, cells were treated with 10 nM insulin for 24 hours and in some experiments with or without 1 ng/ml TNF-α. A. Representative Western blot from tumor endothelial cells cultured from EndoIRKO-Min or control mice. B. Quantitative analysis based on densitometry from 3 independent experiments. C. Representative Western blot from tumor endothelial cells cultured from control animals with intact insulin receptors. D. Quantitative analysis based on densitometry from 3 independent experiments. E. Representative image frames from video of intravital microscopy of mesenteric venules. Leukocytes were labeled by intravenous injection of rhodamine 6G. Arrows point to rolling leukocytes. Scalebar, 100 μm. F. Quantitation of leukocyte rolling in 3 EndoIRKO mice and 4 controls. G. Results from a representative experiment using flow cytometry of enzymatically dissociated tumor cells. H. Quantitation of the frequency of neutrophils (Ly-6G+ cells) in 6 tumors per genotype, analyzed by flow cytometry. I. Quantitation of the frequency of macrophages (F4/80+ cells) in 6 tumors per genotype. All panels: *, p<0.05.

References

    1. Renehan AG, Tyson M, Egger M, Heller RF, Zwahlen M. Body-mass index and incidence of cancer: a systematic review and meta-analysis of prospective observational studies. Lancet. 2008;371:569–78. - PubMed
    1. Yuhara H, Steinmaus C, Cohen SE, Corley DA, Tei Y, Buffler PA. Is diabetes mellitus an independent risk factor for colon cancer and rectal cancer? The American journal of gastroenterology. 2011;106:1911–21. - PMC - PubMed
    1. Gallagher EJ, LeRoith D. Obesity and Diabetes: The Increased Risk of Cancer and Cancer-Related Mortality. Physiol Rev. 2015;95:727–48. - PMC - PubMed
    1. Pollak M. The insulin and insulin-like growth factor receptor family in neoplasia: an update. Nat Rev Cancer. 2012;12:159–69. - PubMed
    1. Sandhu MS, Dunger DB, Giovannucci EL. Insulin, insulin-like growth factor-I (IGF-I), IGF binding proteins, their biologic interactions, and colorectal cancer. Journal of the National Cancer Institute. 2002;94:972–80. - PubMed

Publication types

MeSH terms