. 2017 Jun 2;45(10):5639-5652.
doi: 10.1093/nar/gkx327.

Global miRNA expression analysis identifies novel key regulators of plasma cell differentiation and malignant plasma cell

Affiliations

Global miRNA expression analysis identifies novel key regulators of plasma cell differentiation and malignant plasma cell

Alboukadel Kassambara et al. Nucleic Acids Res. .

Abstract

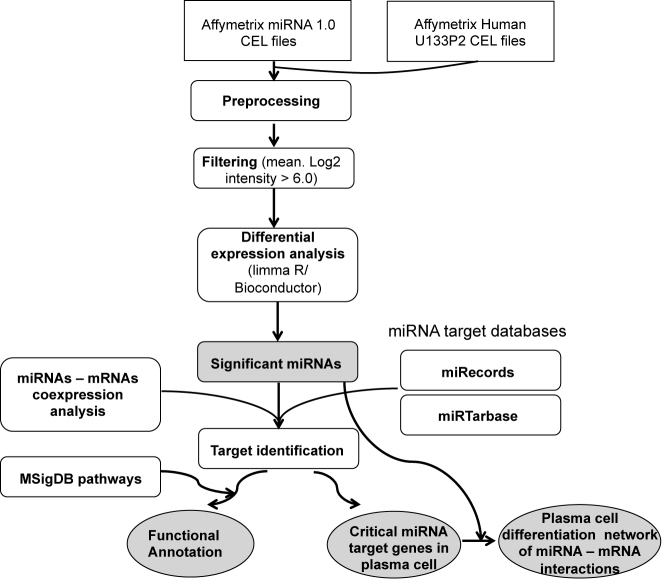
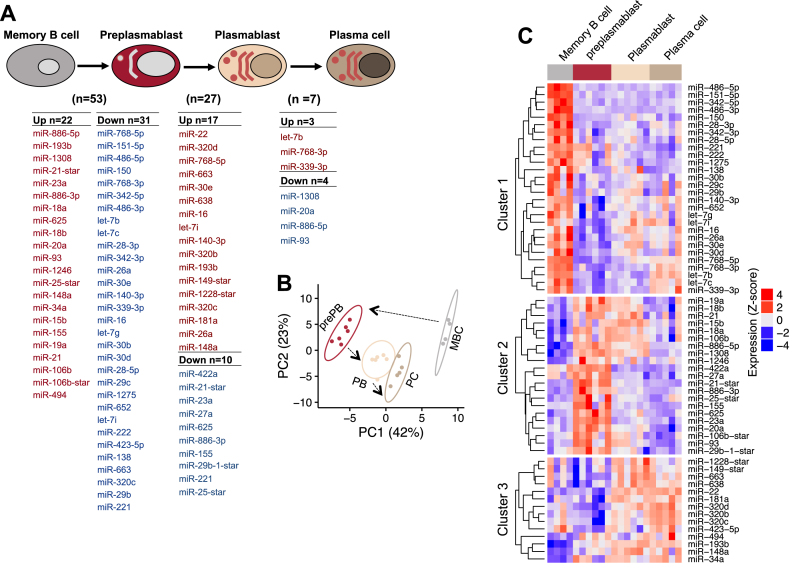
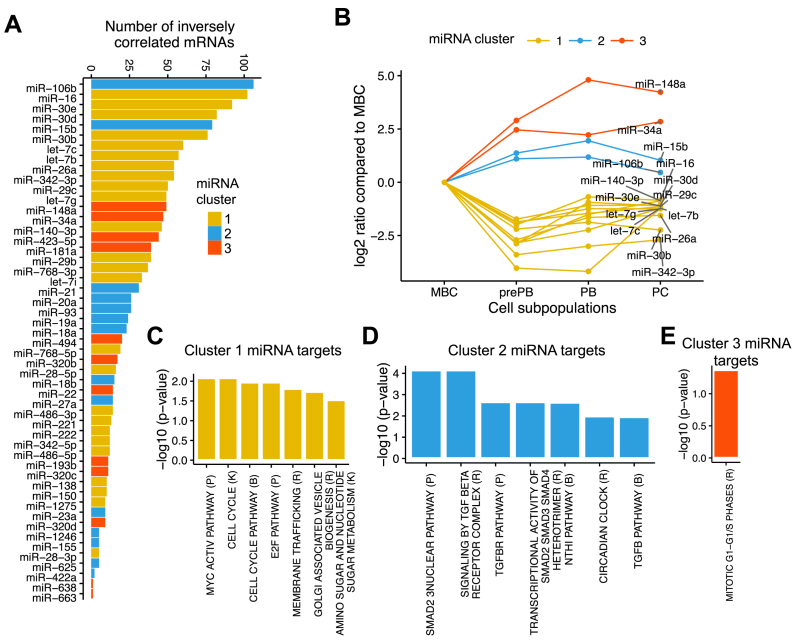
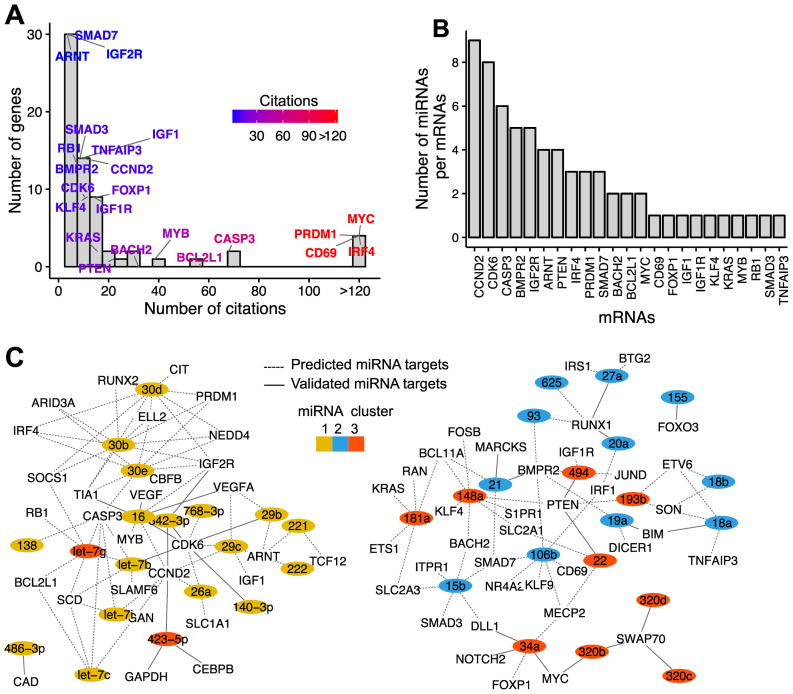
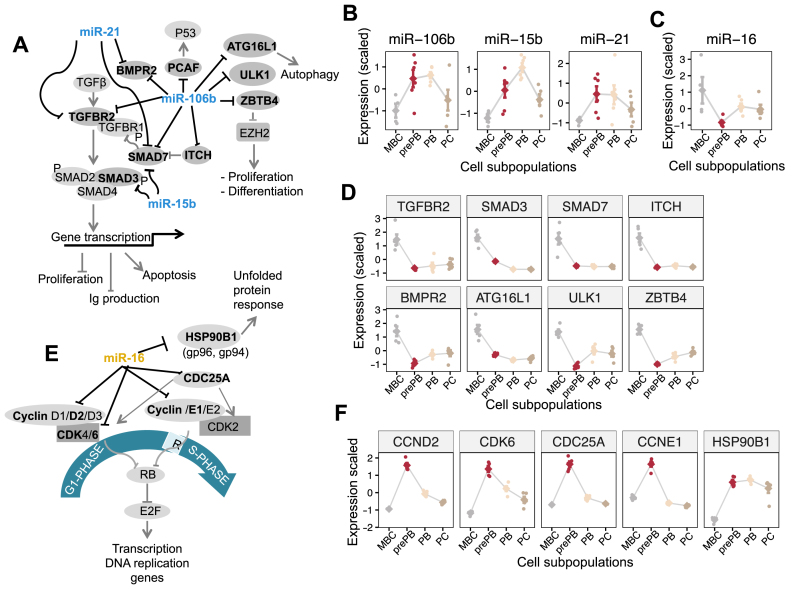
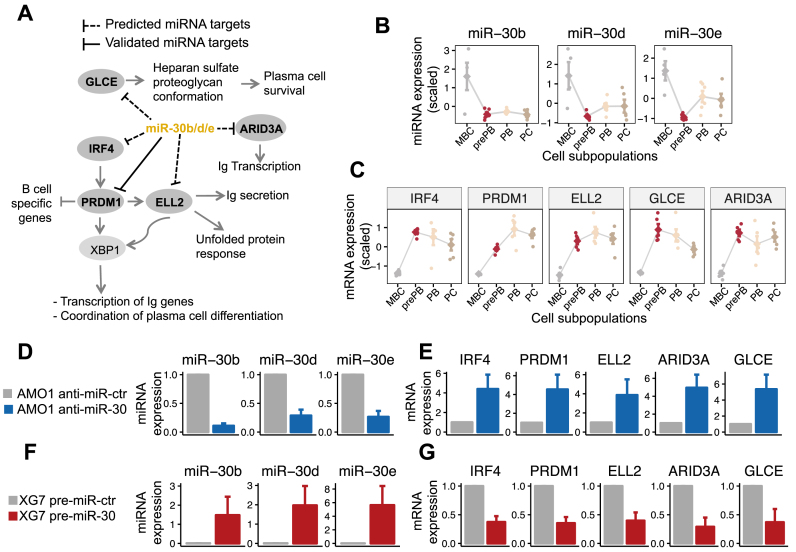
MicroRNAs (miRNAs) are small noncoding RNAs that attenuate expression of their mRNA targets. Here, we developed a new method and an R package, to easily infer candidate miRNA-mRNA target interactions that could be functional during a given biological process. Using this method, we described, for the first time, a comprehensive integrated analysis of miRNAs and mRNAs during human normal plasma cell differentiation (PCD). Our results reveal 63 miRNAs with significant temporal changes in their expression during normal PCD. We derived a high-confidence network of 295 target relationships comprising 47 miRNAs and 141 targets. These relationships include new examples of miRNAs that appear to coordinately regulate multiple members of critical pathways associated with PCD. Consistent with this, we have experimentally validated a role for the miRNA-30b/c/d-mediated regulation of key PCD factors (IRF4, PRDM1, ELL2 and ARID3A). Furthermore, we found that 24 PCD stage-specific miRNAs are aberrantly overexpressed in multiple myeloma (MM) tumor plasma cells compared to their normal counterpart, suggesting that MM cells frequently acquired expression changes in miRNAs already undergoing dynamic expression modulation during normal PCD. Altogether, our analysis identifies candidate novel key miRNAs regulating networks of significance for normal PCD and malignant plasma cell biology.


Figures

Figure 1.
Figure 1.
Computational workflow of data processing and analysis. miRNA and mRNA array data were pre-processed as described in the Supplementary Data. A filtering step was included to select only actively expressed features. Differential expression analysis was performed using the ‘limma’ R package to identify significant differentially expressed miRNAs during plasma cell differentiation. Predicted and validated miRNA targets were collected from miRecords and miRTarbase databases. Co-expression analysis and identification of potential targets were performed directly on the paired miRNA–mRNA data. For a given miRNA, we kept only targeted genes that are differentially expressed during plasma cell differentiation and which expression is negatively correlated to the miRNA. Functional and pathway analysis of miRNA–targeted genes were performed using the clusterProfiler R package (35) and the MSigDB (34) gene set collections.
Figure 2.
Figure 2.
Differentially expressed miRNAs during plasma cell differentiation. Differentially expressed miRNAs were identified using the limma package (adjusted P-value ≤ 0.05 and fold change ≥ 2). (A) List of differentially expressed miRNAs between two consecutive cell subpopulations. Upregulated miRNAs are represented by red color, while downregulated miRNAs are represented by blue color. miRNAs are sorted according to the P-value in ascending order. (B) Principal component analysis grouping plasma cell differentiation cell subpopulations according the expression profile of the significantly differentially expressed miRNAs. Labels represent cell subpopulations: MBC (memory B cell), prePB (preplasmablast), PB (plasmablast), PC (plasma cell). (C) Heat maps representing the expression profile of the differentially expressed miRNA. Expression values were log2 transformed and standardized before the analyses. Three miRNA clusters are detected by k-means.
Figure 3.
Figure 3.
Inferring miRNA targets and identification of the canonical pathways enriched in the targets. The combination of miRNA target prediction databases, differential expression and correlation filters have been used to identify miRNA targets. This analysis yielded 1596 negative miRNAs–mRNAs interactions involving 51 unique miRNAs and 948 unique mRNAs. The clusterProfiler R/Bioconductor package and MSigDB gene set collections are used for functional annotation. For each list, the top seven enriched pathways is shown (adjusted P-value ≤ 0.05). (A) Number of inversely correlated mRNAs per miRNAs. (B) Expression profiles of the top 15 miRNAs that show the highest association with gene expression of their target sets. The log2 ratio compares the expression from preplasmablast (prePB), plasmablast (PB), plasma cell (PC) to memory B cell (MBC). (C) Pathways enriched in genes targeted by miRNAs cluster 1. (D) Pathways enriched in genes targeted by miRNAs cluster 2. (E) Pathways enriched in miRNA cluster 3.
Figure 4.
Figure 4.
Network of miRNAs regulating critical genes in plasma cell differentiation. Using literature-based filtering, we identified 141 miRNA targets with functional relevance in plasma cell differentiation. For better readability, we show only miRNA targeted mRNAs with at least 3 citations (39 miRNAs and 66 miRNA targets). (A) Distribution of the number of citations per gene. Some key genes with functional evidence in plasma cell differentiation are shown. Color intensity indicates the number of citations (blue: low citations, red: high citations). (B) Genes are ordered according to the number miRNAs. (C) Network of miRNA–target interactions. For better readability, Inferred network comprises miRNA targeted mRNAs with at least 3 citations (144 putative target interactions between 39 miRNAs and 66 target mRNAs). Edge line type represents the status of the interaction for a given miRNA–mRNA pair. Solid line types are miRNA - mRNA interactions with experimental support in the literature in other tissues. Dashed line types are predicted interactions. miRNAs are colored by cluster relationships (cluster 1:yellow, cluster 2: blue, cluster 3: red).
Figure 5.
Figure 5.
miRNA regulation of TGF-β pathway components, autophagy, ZBTB4/EZH2 axis and cell cycle. Several miRNAs were represented by many putative target interactions in the inferred plasma cell differentiation miRNA–mRNA network. miR-106b, miR-15b and miR-21, from miRNA cluster 2 (blue color), were represented with several putative target relationships encoding known components of the transforming growth factor (TGF)-β signaling pathway, autophagy and the ZBTB4/EZH2 axis. miR-16, from miRNA cluster 1 (yellow color) targets G1/S transition genes and HSP90B1. The figure shows the pathways as well as the expression profile of the different miRNAs and target mRNAs. Expression values are standardized before plotting. (A) Association between miR-106b, miR-15b, miR-21 and predicted target mRNAs: TGF-β pathway (TGFBR2, SMAD3, SMAD7, ITCH and BMPR2), autophagy (ATG16L1 and ULK1) and ZBTB4. (B) Expression profile of miR-106b, miR15b and miR-21 during plasma cell differentiation. (C) Expression profile of miR-16 during plasma cell differentiation. (D) Expression profile of miR-106b, miR15b and miR-21 target mRNAs. (E) Association between miR-16 and target mRNAs: G1/S transition genes (CCND2, CCNE1, CDK6 and CDC25A) and HSP90B1. (F) Expression profile of miR-16 target mRNAs.
Figure 6.
Figure 6.
miR-30 family in coordinating plasma cell differentiation and experimental validation. Four biological replicates are performed for experimental validation. The means and the standard error of the mean are displayed in the bar plots. (A) Association between miR-30 family members and predicted target genes with critical role in plasma cell differentiation, including IRF4, PRDM1, ELL2, ARID3A and GLCE. (B) Expression profile of miR-30 family members during plasma cell differentiation. (C) Expression profile of miR-30 target mRNAs. Expression values are standardized before plotting. (D) Inhibition of miR-30b/d/e in AMO1 cell line. Relative expression of miR-30b/d/e 48 h after transfection with antisense oligonucleotides anti-miR-30b/d/e and anti-miR-control in AMO1 cells. (E) Effects of miR-30b/d/e inhibition on the expression level of target mRNAs. (F) Overexpression of miR-30b/d/e in XG7 cell line. Expression of miR-30b/d/e 48 after transfection with precursor miRNAs pre-miR-30b/d/e and pre-miR-control in XG7 cells. (G) Effects of miR-30b/d/e overexpression on the expression level of target mRNAs.

References

    1. Shapiro-Shelef M., Calame K.. Regulation of plasma-cell development. Nat. Rev. Immunol. 2005; 5:230–242. - PubMed
    1. Jourdan M., Caraux A., Caron G., Robert N., Fiol G., Reme T., Bollore K., Vendrell J.P., Le Gallou S., Mourcin F. et al. . Characterization of a transitional preplasmablast population in the process of human B cell to plasma cell differentiation. J. Immunol. 2011; 187:3931–3941. - PubMed
    1. Jourdan M., Cren M., Robert N., Bollore K., Fest T., Duperray C., Guilloton F., Hose D., Tarte K., Klein B.. IL-6 supports the generation of human long-lived plasma cells in combination with either APRIL or stromal cell-soluble factors. Leukemia. 2014; 28:1647–1656. - PubMed
    1. Nutt S.L., Hodgkin P.D., Tarlinton D.M., Corcoran L.M.. The generation of antibody-secreting plasma cells. Nat. Rev. Immunol. 2015; 15:160–171. - PubMed
    1. Shaffer A.L., Lin K.I., Kuo T.C., Yu X., Hurt E.M., Rosenwald A., Giltnane J.M., Yang L., Zhao H., Calame K. et al. . Blimp-1 orchestrates plasma cell differentiation by extinguishing the mature B cell gene expression program. Immunity. 2002; 17:51–62. - PubMed

MeSH terms