. 2017 Aug 1;34(8):2115-2122.
doi: 10.1093/molbev/msx148.

Fast Genome-Wide Functional Annotation through Orthology Assignment by eggNOG-Mapper

Affiliations

Fast Genome-Wide Functional Annotation through Orthology Assignment by eggNOG-Mapper

Jaime Huerta-Cepas et al. Mol Biol Evol. .

Abstract

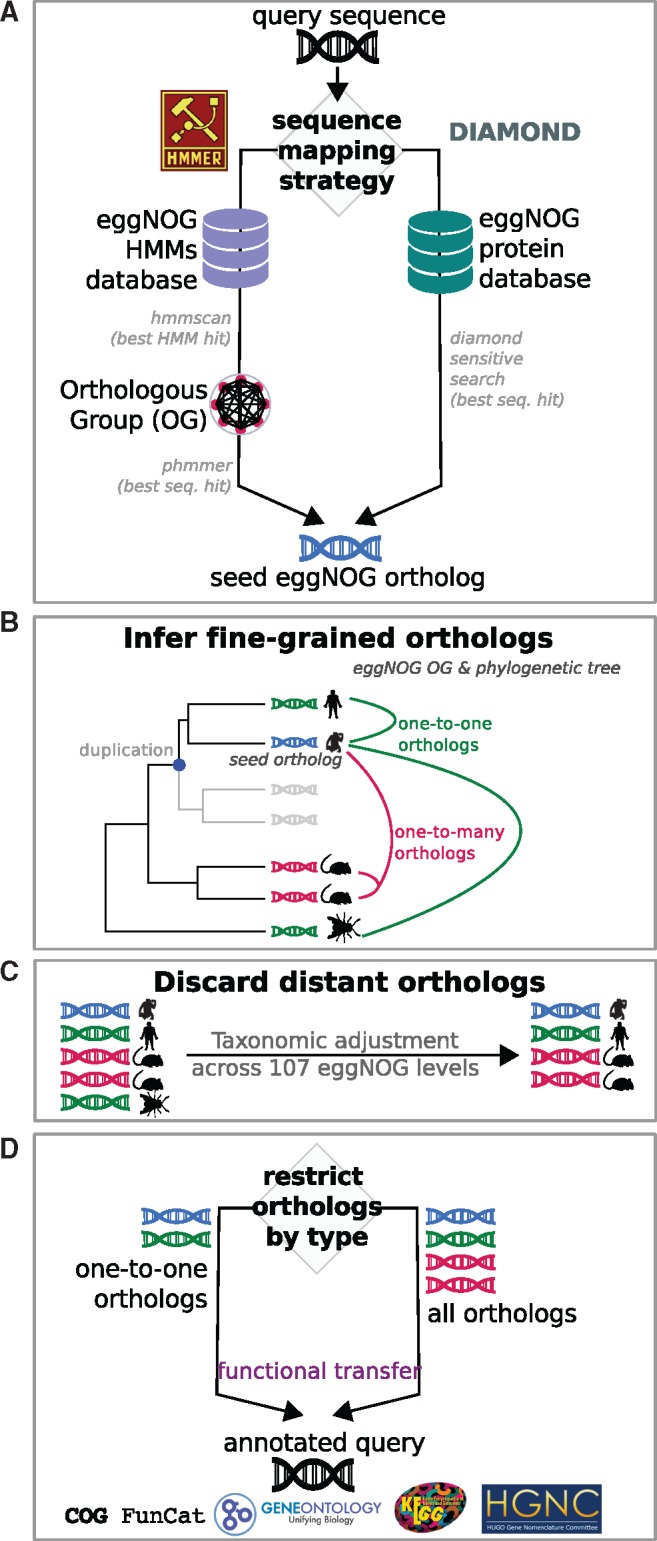
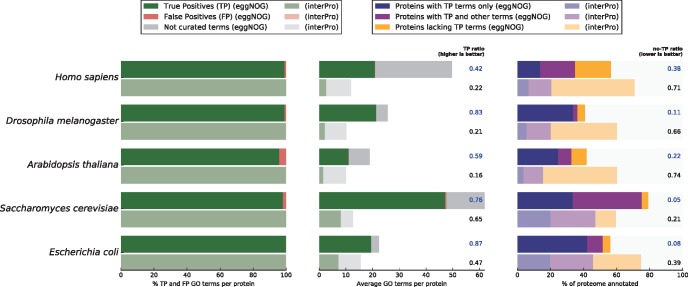
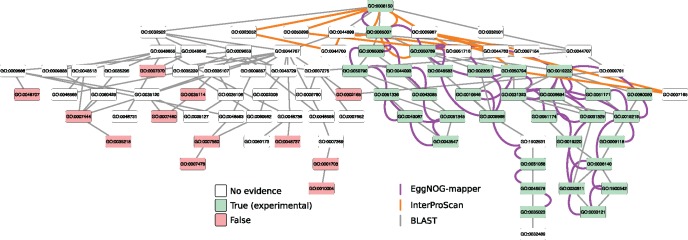
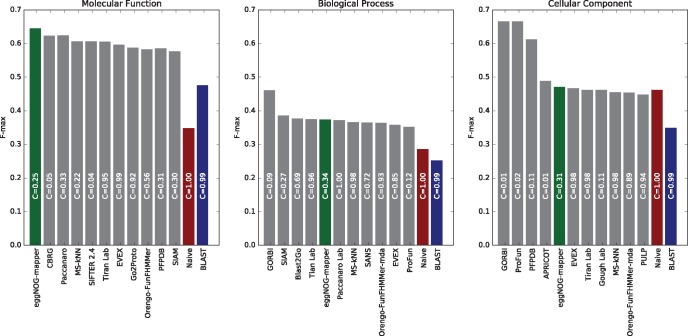
Orthology assignment is ideally suited for functional inference. However, because predicting orthology is computationally intensive at large scale, and most pipelines are relatively inaccessible (e.g., new assignments only available through database updates), less precise homology-based functional transfer is still the default for (meta-)genome annotation. We, therefore, developed eggNOG-mapper, a tool for functional annotation of large sets of sequences based on fast orthology assignments using precomputed clusters and phylogenies from the eggNOG database. To validate our method, we benchmarked Gene Ontology (GO) predictions against two widely used homology-based approaches: BLAST and InterProScan. Orthology filters applied to BLAST results reduced the rate of false positive assignments by 11%, and increased the ratio of experimentally validated terms recovered over all terms assigned per protein by 15%. Compared with InterProScan, eggNOG-mapper achieved similar proteome coverage and precision while predicting, on average, 41 more terms per protein and increasing the rate of experimentally validated terms recovered over total term assignments per protein by 35%. EggNOG-mapper predictions scored within the top-5 methods in the three GO categories using the CAFA2 NK-partial benchmark. Finally, we evaluated eggNOG-mapper for functional annotation of metagenomics data, yielding better performance than interProScan. eggNOG-mapper runs ∼15× faster than BLAST and at least 2.5× faster than InterProScan. The tool is available standalone and as an online service at http://eggnog-mapper.embl.de.

Keywords: comparative genomics; functional annotation; gene function; genomics; metagenomics; orthology.


Figures

<sc>Fig</sc>. 1
Fig. 1
eggNOG-mapper workflow. Schematic representation of the eggNOG-mapper workflow and its different execution modes. (A) Sequence mapping step showing two available options: HMM-based searches (left), and DIAMOND-based searches (right). For each query, both options lead to the best seed ortholog in eggNOG. (B) Inference of fine-grained orthologs based on the precomputed eggNOG phylogenies associated to the Orthologous Groups (OG) where the seed ortholog was found. (C) Fine grained orthologs are further filtered based on taxonomic criteria. Distant orthologs are automatically excluded unless manually specified. (D) Functional transfer is performed using either one-to-one orthologs or all available orthologs. Gene Ontology terms, KEGG pathways, COG functional categories and predicted gene names are transferred from orthologs to query.
<sc>Fig</sc>. 2
Fig. 2
eggNOG-mapper versus BLAST based Gene Ontology annotations. Comparison of the annotation results for five model species using eggNOG-mapper in HMMER mode (brighter colors) and BLAST (dimmed colors). Left panel shows the per-protein average proportion of true positive GO term assignments (TP, green, experimentally validated) to false positive term assignments (FP, red, derived from taxonomic exclusion criteria). Within each plot, consecutive pairs of horizontal bars represent different BLAST E-value cutoffs ranging from 1E-03 to 1E-40, with sequence matches under this cutoff being excluded from both BLAST and eggNOG-mapper hits. Middle panel shows the per-protein average number of true positive GO term assignments (green), false positive term assignments (red), and assignments of GO terms where neither curated evidence nor taxonomic exclusion criteria holds (grey). Next to the plot is shown the ratio of true positive term assignments (TP-ratio) over the total number of assignments (including false and uncertain terms, CAFA2 approach). Right panel shows the percentage of each proteome that receives annotation, indicating the fraction of proteins that were annotated exclusively with curated true positive terms (TP, blue); proteins annotated with curated terms but also false or uncertain assignments (purple); and proteins that only received false or uncertain assignments (orange, proportion used to compute the no-TP ratio column).
<sc>Fig</sc>. 3
Fig. 3
eggNOG-mapper versus InterProScan. Comparison of the annotation results for five model species using eggNOG-mapper in HMMER mode and with default parameters (brighter colors) and InterProScan (dimmed colors) with default parameters and without further restrictions. The left panel shows the per-protein average proportion of true positive GO term assignments (TP, green, experimentally validated) to false positive term assignments (FP, red, derived from taxonomic exclusion criteria). Consecutive pairs of horizontal bars represent each species in the benchmark. The middle panel shows the per-protein average number of true positive GO term assignments (green), false positive term assignments (red), and assignments of GO terms where neither curated evidence nor taxonomic exclusion criteria hold (grey). Next to the plot is shown the ratio of true positive term assignments (TP-ratio) over the total number of assignments (including false and uncertain assignments, CAFA2 approach). The right panel shows the percentage of each proteome that receives annotation, indicating the fraction of proteins that were annotated exclusively with curated true positive terms (TP, blue); proteins annotated with curated terms but also false or uncertain assignments (purple); and proteins that only received false or uncertain assignments (orange, proportion used to compute the no-TP ratio column).
<sc>Fig</sc>. 4
Fig. 4
Example of eggNOG-mapper, BLAST and interProScan annotations. Example of differential Gene Ontology annotation (Biological Process sub-ontology) for the human protein RHOGAP1 (Rho GTPase activating protein 1, ENSP00000310491) using three alternative methods: BLAST (grey edges), InterProScan (orange), and eggNOG-mapper (purple). The network figure shows the experimentally validated “gold standard” annotations (green nodes), the annotations possible to exclude from taxonomy (red nodes), and annotations neither possible to conclude nor exclude from curated Gene Ontology data (white nodes). All annotations are linked with edges reflecting the Gene Ontology DAG hierarchy. Gray edges connect all GO terms concluded from BLAST analysis, orange edges those concluded from InterProScan, and purple edges those concluded using eggNOG-mapper. Notably, while a BLAST-based approach recovers all curated annotations, in this case it does so at the cost of substantial numbers of false positives and uncertain terms. InterProScan is accurate but obtains only a more general annotation, whereas eggNOG-mapper achieves more detailed resolution.
<sc>Fig</sc>. 5
Fig. 5
eggNOG-mapper under the CAFA2 benchmark. Evaluation of eggNOG-mapper using CAFA2 benchmark data set. Evaluation was carried out on No-Knowledge (NK) benchmark sequences in the partial mode. The coverage of each method is shown within its performance bar. Accuracy of the methods is represented by the F-max measure (F-max = 1 being a perfect predictor). eggNOG-mapper results (DIAMOND mode) are shown in green. For details on the other methods shown, refer to Jiang et al. (2016).

References

    1. Altenhoff AM, Boeckmann B, Capella-Gutierrez S, Dalquen DA, DeLuca T, Forslund K, Huerta-Cepas J, Linard B, Pereira C, Pryszcz LP, et al.2016. Standardized benchmarking in the quest for orthologs. Nat Methods. 13:425–430. - PMC - PubMed
    1. Buchfink B, Xie C, Huson DH.. 2015. Fast and sensitive protein alignment using DIAMOND. Nat Methods. 12:59–60. - PubMed
    1. Burge S, Kelly E, Lonsdale D, Mutowo-Muellenet P, McAnulla C, Mitchell A, Sangrador-Vegas A, Yong S-Y, Mulder N, Hunter S.. 2012. Manual GO annotation of predictive protein signatures: the InterPro approach to GO curation. Database 2012:bar068.. - PMC - PubMed
    1. Deegan née Clark JI, Dimmer EC, Mungall CJ.. 2010. Formalization of taxon-based constraints to detect inconsistencies in annotation and ontology development. BMC Bioinformatics. 11:530.. - PMC - PubMed
    1. Eddy SR. 2011. Accelerated profile HMM searches. PLoS Comput Biol. 7:e1002195.. - PMC - PubMed

Publication types