

RAB10 overexpression promotes tumor growth and indicates poor prognosis of hepatocellular carcinoma
- PMID: 28460436
- PMCID: PMC5432270
- DOI: 10.18632/oncotarget.15507
RAB10 overexpression promotes tumor growth and indicates poor prognosis of hepatocellular carcinoma
Abstract
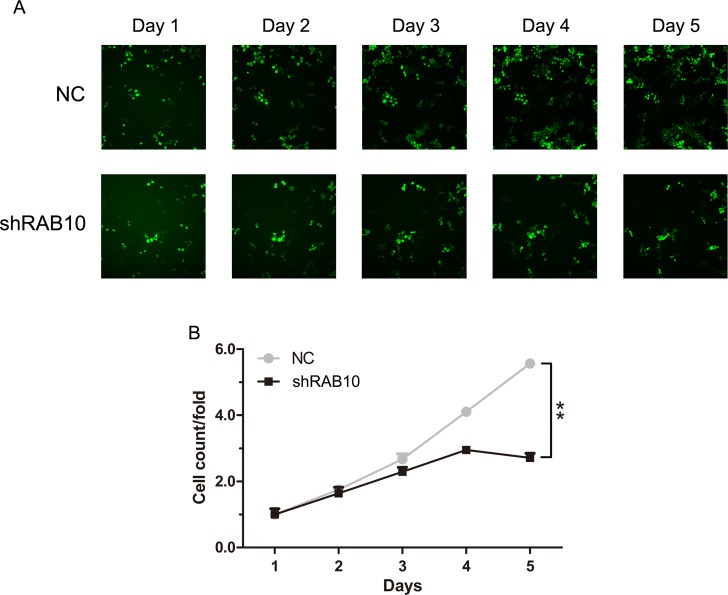
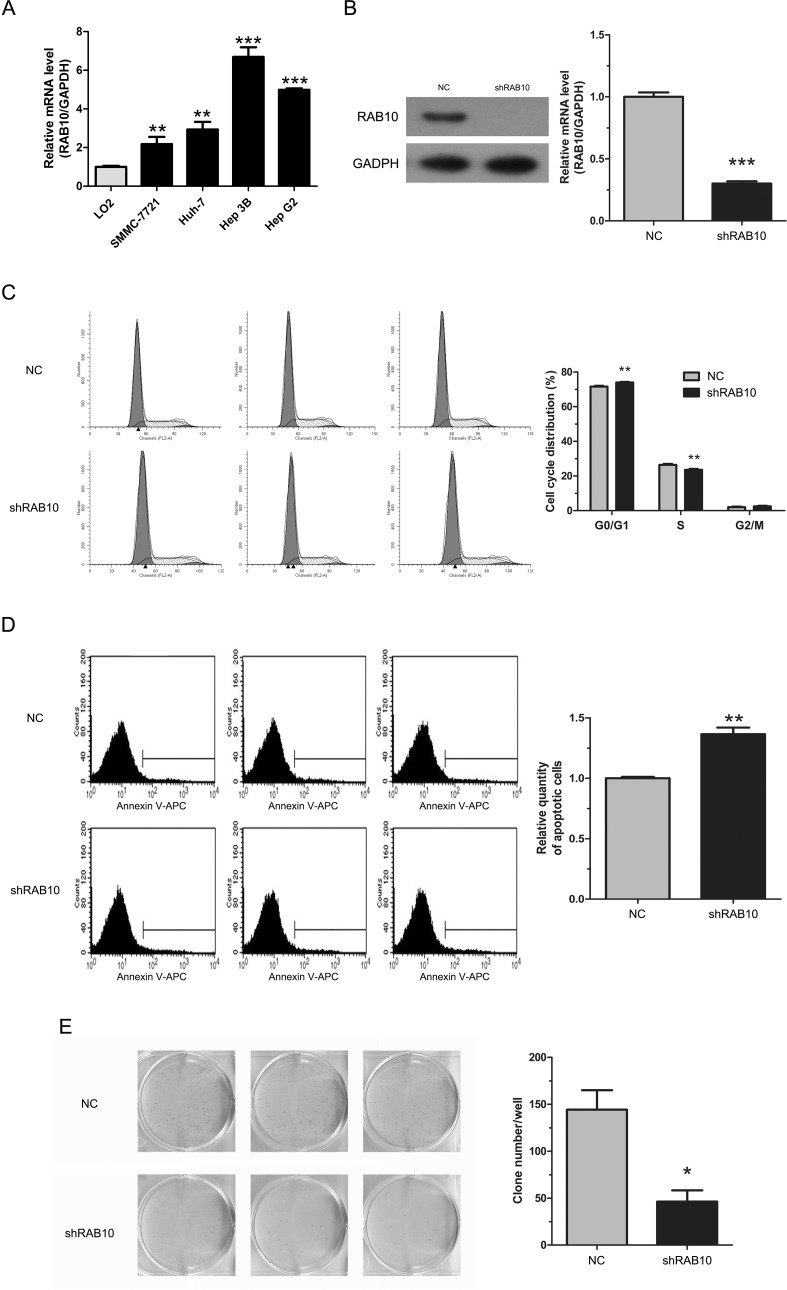
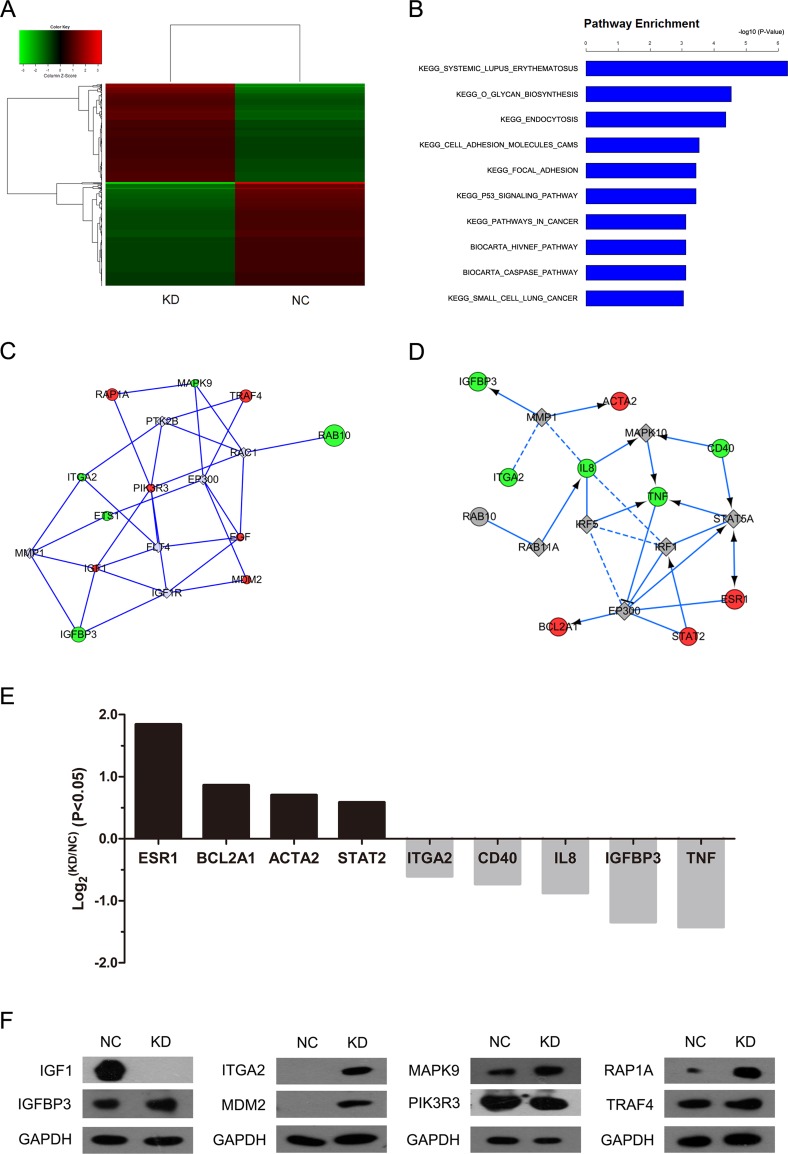
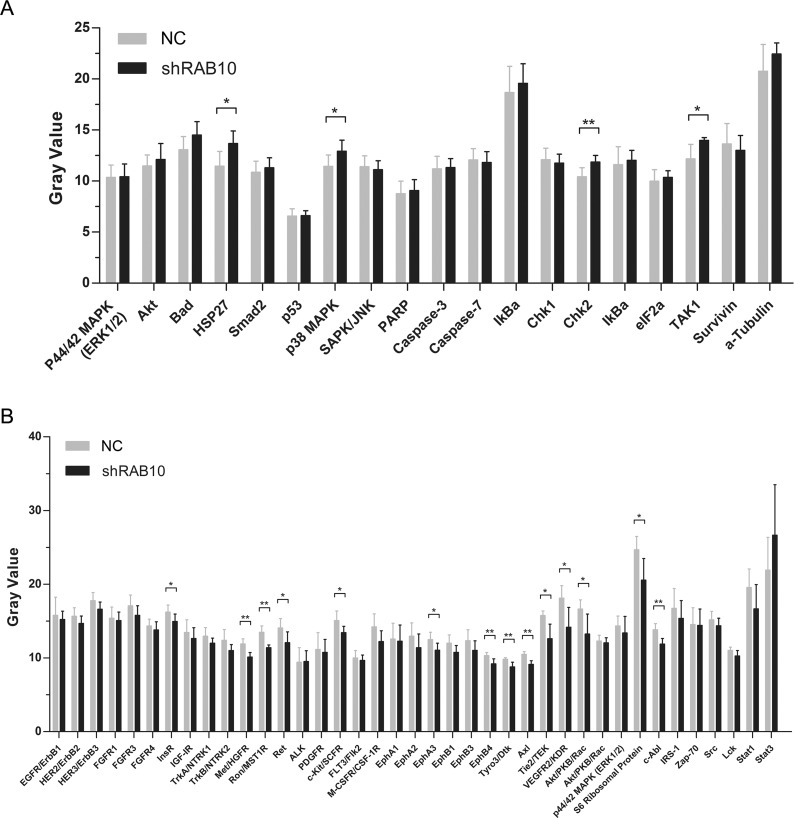
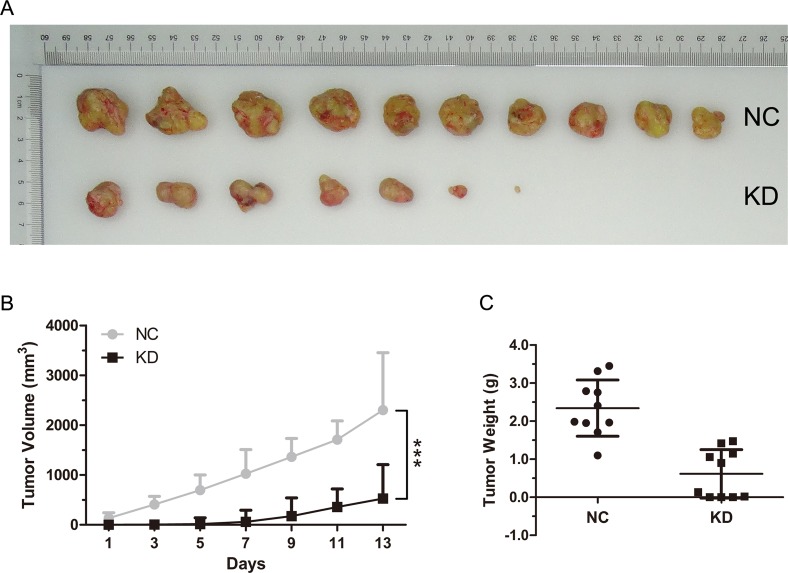
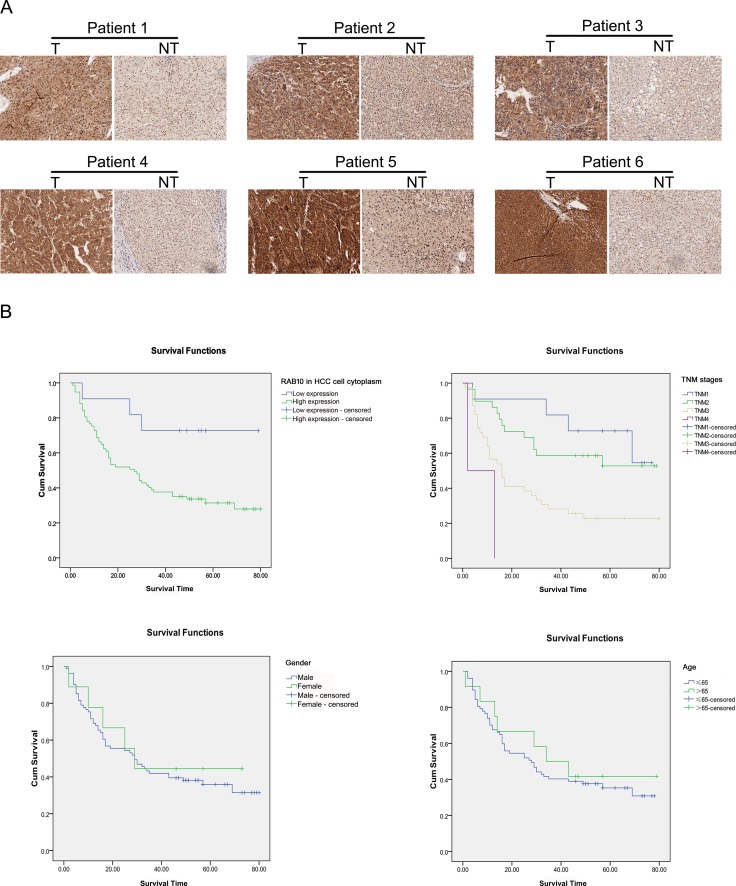
Hepatocellular carcinoma (HCC), one of the most common and lethal cancers worldwide, has a high recurrence rate with current treatment modalities. Identifying biomarkers for early diagnosis and discovering new sufficient molecular targets for the development of targeted therapies are urgently needed. RAB10, a member of the RAS family, has been shown to be highly expressed in HCC. However, the function of RAB10 in HCC is less studied. Here we report that RAB10 acts as an oncogene in HCC. The shRNA-mediated knockdown of RAB10 significantly reduced the proliferation of HCC cells and colony formation, induced cell cycle arrest at G0/G1 phase and increased apoptosis in vitro. In addition, RAB10 knockdown suppressed HCC growth in nude mice. Moreover, RAB10 silencing decreased the phosphorylation of InsR, Met/HGFR, Ron/MST1R, Ret, c-Kit/SCFR, EphA3, EphB4, Tyro3/Dtk, Axl, Tie2/TEK, VEGFR2/KDR, Akt/PKB/Rac, S6 Ribosomal Protein and c-Abl, while the phosphorylation of HSP27, p38 MAPK, Chk2 and TAK1 increased significantly. These results suggest that RAB10 regulates cell survival and proliferation through multiple oncogenic, cell stress and apoptosis pathways. More importantly, high RAB10 expression levels in HCC cells correlated with a poor prognosis in HCC patients. Therefore, our findings revealed an oncogenic role for RAB10 in the pathogenesis of HCC and that RAB10 is a potential molecular target or a biomarker for HCC.
Keywords: RAB10; biomarker; hepatocellular carcinoma; oncogene; therapeutic target.
Conflict of interest statement
None.
Figures
Similar articles
-
The RNA-binding protein Sam68 regulates tumor cell viability and hepatic carcinogenesis by inhibiting the transcriptional activity of FOXOs.J Mol Histol. 2015 Dec;46(6):485-97. doi: 10.1007/s10735-015-9639-y. Epub 2015 Oct 5. J Mol Histol. 2015. PMID: 26438629
-
MiR-425-5p promotes invasion and metastasis of hepatocellular carcinoma cells through SCAI-mediated dysregulation of multiple signaling pathways.Oncotarget. 2017 May 9;8(19):31745-31757. doi: 10.18632/oncotarget.15958. Oncotarget. 2017. PMID: 28423650 Free PMC article.
-
Increased Expression of SETD7 Promotes Cell Proliferation by Regulating Cell Cycle and Indicates Poor Prognosis in Hepatocellular Carcinoma.PLoS One. 2016 May 16;11(5):e0154939. doi: 10.1371/journal.pone.0154939. eCollection 2016. PLoS One. 2016. PMID: 27183310 Free PMC article.
-
MCM family in HCC: MCM6 indicates adverse tumor features and poor outcomes and promotes S/G2 cell cycle progression.BMC Cancer. 2018 Feb 20;18(1):200. doi: 10.1186/s12885-018-4056-8. BMC Cancer. 2018. PMID: 29463213 Free PMC article. Review.
-
Targeting ZBP-89 for the treatment of hepatocellular carcinoma.Expert Opin Ther Targets. 2018 Oct;22(10):817-822. doi: 10.1080/14728222.2018.1516753. Epub 2018 Sep 6. Expert Opin Ther Targets. 2018. PMID: 30142986 Review.
Cited by
-
microRNA-519d Induces Autophagy and Apoptosis of Human Hepatocellular Carcinoma Cells Through Activation of the AMPK Signaling Pathway via Rab10.Cancer Manag Res. 2020 Apr 15;12:2589-2602. doi: 10.2147/CMAR.S207548. eCollection 2020. Cancer Manag Res. 2020. PMID: 32346312 Free PMC article.
-
Bioinformatics Analysis Identifies Lipid Droplet-Associated Gene Signatures as Promising Prognostic and Diagnostic Models for Endometrial Cancer.Cancer Rep (Hoboken). 2025 Aug;8(8):e70313. doi: 10.1002/cnr2.70313. Cancer Rep (Hoboken). 2025. PMID: 40804485 Free PMC article.
-
RABIF promotes hepatocellular carcinoma progression through regulation of mitophagy and glycolysis.Commun Biol. 2024 Oct 16;7(1):1333. doi: 10.1038/s42003-024-07028-1. Commun Biol. 2024. PMID: 39414994 Free PMC article.
-
Multiplexed kinase interactome profiling quantifies cellular network activity and plasticity.Mol Cell. 2023 Mar 2;83(5):803-818.e8. doi: 10.1016/j.molcel.2023.01.015. Epub 2023 Feb 2. Mol Cell. 2023. PMID: 36736316 Free PMC article.
-
The anti-oncogenic effect of 17-DMAG via the inactivation of HSP90 and MET pathway in osteosarcoma cells.Oncol Res. 2023 Jul 21;31(5):631-643. doi: 10.32604/or.2023.029745. eCollection 2023. Oncol Res. 2023. PMID: 37547755 Free PMC article.
References
-
- Blechacz B, Mishra L. Hepatocellular carcinoma biology. Recent Results Cancer Res. 2013;190:1–20. - PubMed
-
- Semela D, Dufour JF. Angiogenesis and hepatocellular carcinoma. J Hepatol. 2004;41:864–880. - PubMed
-
- Daste A, Chakiba C, Domblides C, Gross-Goupil M, Quivy A, Ravaud A, Soubeyran P. Targeted therapy and elderly people: A review. Eur J Cancer. 2016;69:199–215. - PubMed
MeSH terms
Substances
LinkOut - more resources
Full Text Sources
Other Literature Sources
Medical
Research Materials
Miscellaneous
