. 2017 May 1;15(1):93.
doi: 10.1186/s12967-017-1196-6.

Up-regulated expression of substance P in CD8+ T cells and NK1R on monocytes of atopic dermatitis

Affiliations

Up-regulated expression of substance P in CD8+ T cells and NK1R on monocytes of atopic dermatitis

Zenan Zhang et al. J Transl Med. .

Abstract

Background: Large numbers of CD8+ T cells were observed in atopic dermatitis (AD) skin, and monocytes from AD patients showed increased prostaglandin E2 production. However, little is known about the expression of substance P (SP) and its receptor NK1R in blood leukocytes of patients with AD.

Objective: To explore the expression of SP and NK1R in leukocytes of AD and the influence of allergens on SP and NK1R expression.

Methods: The expression levels of SP and NK1R in patients with AD were examined by flow cytometry, ELISA and a mouse AD model.

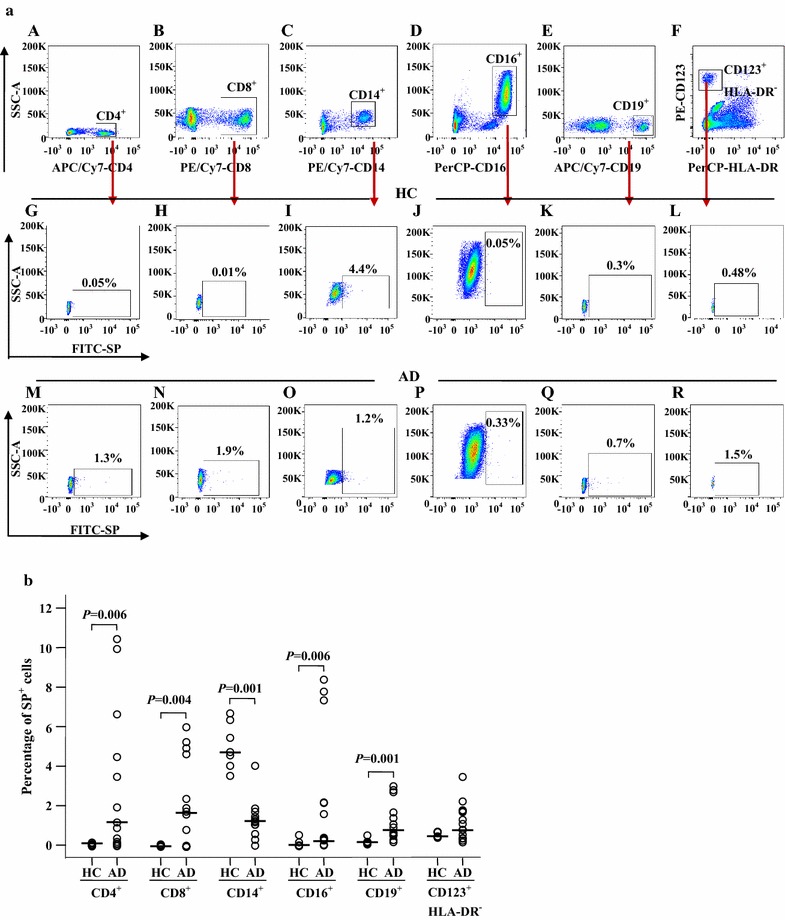
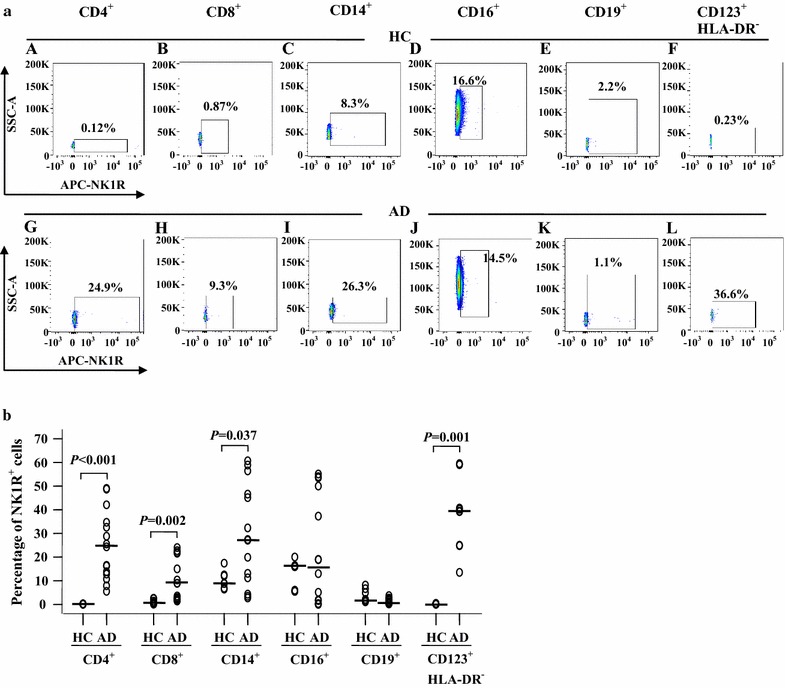
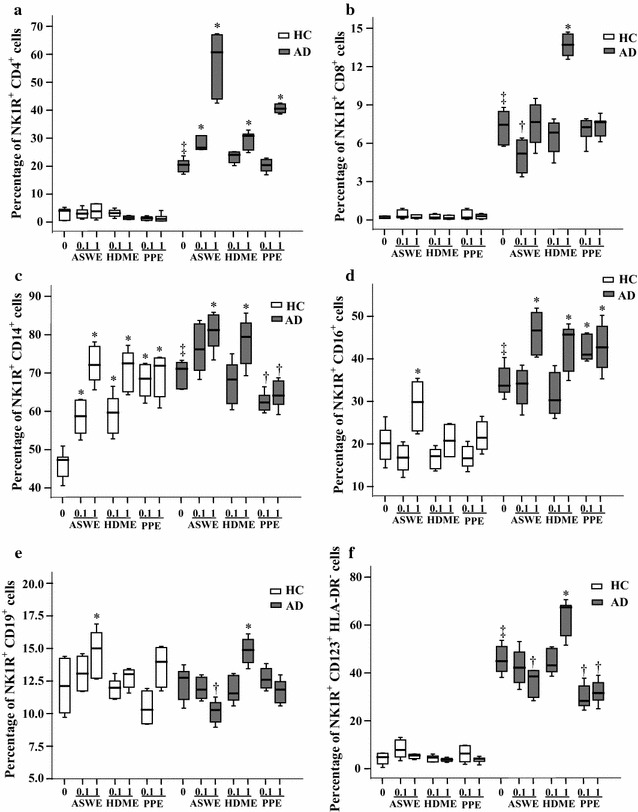
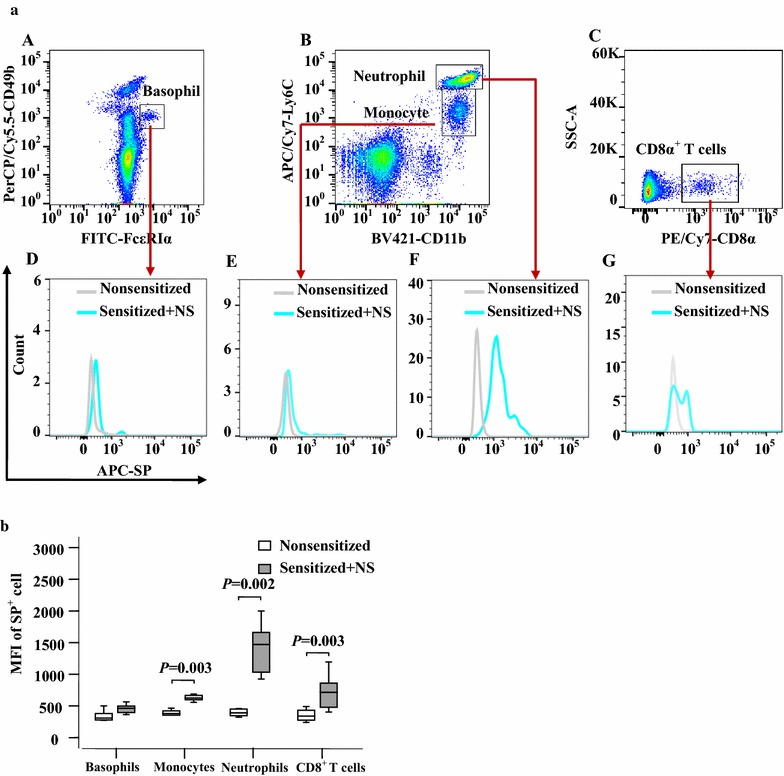
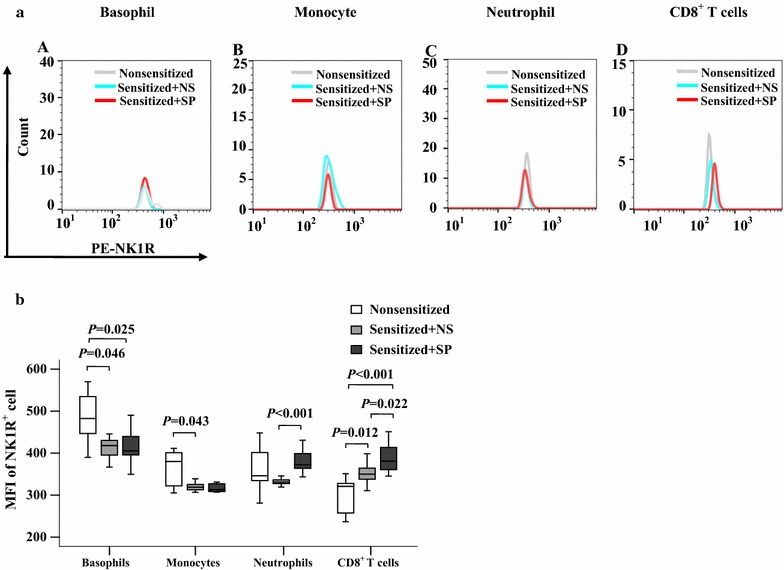
Results: The plasma SP level was 4.9-fold higher in patients with AD than in HC subjects. Both the percentage of SP expression in the population and mean fluorescence intensity (MFI) of SP expression were elevated in CD8+ T cells in the blood of AD patients. However, both the CD14+NK1R+ population and MFI of NK1R expression on CD14+ cells were enhanced in the blood of AD patients. Allergens ASWE, HDME and PPE failed to up-regulate SP expression in CD8+ T cells. However, allergens ASWE and HDME both enhanced NK1R expression on CD14+ blood leukocytes regardless of AD or HC subjects. OVA-sensitized AD mice showed an elevated proportion and MFI of SP-expressing CD8+ T cells in the blood, which agrees with the SP expression situation in human AD blood. Injection of SP into mouse skin did not up-regulate NK1R expression on monocytes.

Conclusions: An elevated plasma SP level, up-regulated expression of SP and NK1R indicate that the SP/NK1R complex is important in the development of AD. Therefore, SP and NK1R antagonist or blocker agents may help to treat patients with AD. Trial registration Registration number: ChiCTR-BOC-16010279; Registration date: Dec., 28, 2016; retrospectively registered.

Keywords: Allergen; NK1R; Substance P; T cell.


Figures

Fig. 1
Fig. 1
Scatter plots of levels of substance P (SP) in the plasma of patients with atopic dermatitis (AD), food allergy, drug allergy and healthy control (HC) subjects. Each symbol represents the value from one subject. The median value is indicated by a horizontal line. P < 0.05 was considered statistically significant
Fig. 2
Fig. 2
Flow cytometry analysis of expression of substance P (SP) in the peripheral blood leukocytes of patients with atopic dermatitis (AD) and healthy control (HC) subjects. a Representative graphs of the percentage of SP+ cells out of the corresponding leukocyte population. (A), (B), (C), (D), (E) and (F) show the gating strategies of different leukocyte populations indicated. (G), (H), (I), (J), (K) and (L) represent SP+ populations of CD4+ (helper T cells), CD8+ (cytotoxic T cells), CD14+ (monocytes), CD16+ (neutrophils), CD19+ cells (B cells), and CD123+HLA-DR (basophils) in HC subjects, respectively. (M), (N), (O), (P), (Q) and (R) represent SP+ populations of CD4+, CD8+, CD14+, CD16+, CD19+, and CD123+HLA-DR cells in patients with AD, respectively. b The median values of the percentage of SP+ cells from AD and HC subjects. Each symbol represents the value from one subject. The median value is indicated by a horizontal line. P < 0.05 was taken as statistically significant
Fig. 3
Fig. 3
Flow cytometry analysis of expression of substance P (SP) in the peripheral blood leukocytes of patients with atopic dermatitis (AD) and healthy control (HC) subjects. a Representative graphs of the changes in mean fluorescence intensity (MFI) of SP in (A) CD4+, (B) CD8+, (C) CD14+, (D) CD16+, (E) CD19+, and (F) CD123+HLA-DR cells, respectively, in AD and HC subjects. b The median values of MFI of SP+ cells from AD and HC subjects. Each symbol represents the value from one subject. The median value is indicated by a horizontal line. P < 0.05 was considered statistically significant
Fig. 4
Fig. 4
Flow cytometry analysis of expression of NK1R in peripheral blood leukocytes of patients with AD and healthy control (HC) subjects. a Representative graphs of the percentage of NK1R+ cells out of the corresponding leukocyte population. (A), (B), (C), (D), (E) and (F) represent NK1R+ populations of CD4+ (helper T cells), CD8+ (cytotoxic T cells), CD14+ (monocytes), CD16+ (neutrophils), CD19+ (B cells), and CD123+HLA-DR cells (basophils) in HC subjects, respectively. (G), (H), (I), (J), (K) and (L) represent NK1R+ populations of CD4+, CD8+, CD14+, CD16+, CD19+, and CD123+HLA-DR cells in patients with AD, respectively. b The median values of the percentage of NK1R+ cells from AD and HC subjects. Each symbol represents the value from one subject. The median value is indicated by a horizontal line. P < 0.05 was considered statistically significant
Fig. 5
Fig. 5
Flow cytometry analysis of expression of NK1R in peripheral blood leukocytes of patients with AD and healthy control (HC) subjects. a Representative graphs of the changes in mean fluorescence intensity (MFI) of NK1R in (A) CD4+, (B) CD8+, (C) CD14+, (D) CD16+, (E) CD19+, and (F) CD123+HLA-DR cells, respectively, in AD and HC subjects. b The median values of MFI of NK1R+ cells from AD and HC subjects. Each symbol represents the value from one subject. The median value is indicated by a horizontal line. P < 0.05 was considered statistically significant
Fig. 6
Fig. 6
Induction of SP expression in peripheral blood leukocytes by allergens in healthy control (HC) subjects and patients with atopic dermatitis (AD). Cells were challenged by Artemisia sieversiana wild allergen extract (ASWE), house dust mite allergen extract (HDME), or Platanus pollen allergen extract (PPE) (all at concentrations of 0.1 and 1.0 μg/ml) at 37 °C for 1 h. (A), (B), (C), (D), (E) and (F) represent SP+ populations of CD4+ (helper T cells), CD8+ (cytotoxic T cells), CD14+ (monocytes), CD16+ (neutrophils), CD19+ (B cells), and CD123+HLA-DR cells (basophils) in HC subjects and patients with AD, respectively. The data are displayed as a boxplot for 8 HC subjects or 10 patients with AD, which indicates the median, interquartile range, and the largest and smallest values. *P < 0.05 compared with the increased response to the corresponding medium alone control. P < 0.05 compared with the decreased response to the corresponding medium alone control. P < 0.05 compared with the response to the corresponding medium alone control of HC subject groups (paired Mann–Whitney U test)
Fig. 7
Fig. 7
Induction of NK1R expression in peripheral blood leukocytes by allergens in healthy control (HC) subjects and patients with atopic dermatitis (AD). Cells were challenged by Artemisia sieversiana wild allergen extract (ASWE), house dust mite allergen extract (HDME), or Platanus pollen allergen extract (PPE) (all at concentrations of 0.1 and 1.0 μg/ml) at 37 °C for 1 h. (A), (B), (C), (D), (E) and (F) represent NK1R+ populations of CD4+ (helper T cells), CD8+ (cytotoxic T cells), CD14+ (monocytes), CD16+ (neutrophils), CD19+ (B cells), and CD123+HLA-DR cells (basophils) in HC subjects and patients with AD, respectively. The data are displayed as a boxplot for 8 HC subjects or 10 patients with AD, which indicates the median, interquartile range, and the largest and smallest values. *P < 0.05 compared with the increased response to the corresponding medium alone control. P < 0.05 compared with the decreased response to the corresponding medium alone control. P < 0.05 compared with the response to the corresponding medium alone control of HC subject groups (paired Mann–Whitney U test)
Fig. 8
Fig. 8
Flow cytometry analysis of expression of substance P (SP) in mouse blood leukocytes. a Representative graphs of percentages of SP+ leukocytes in the blood of non-sensitized and sensitized mice, respectively. (A) and (C) are fluorescence minus one (FMO) for SP; (B) and (D) are all fluorescence (AF) of SP+ leukocytes. b Demonstrates median percentage values of SP+ leukocytes in mouse blood. The data shown are the median (range) value from six different mice. *P < 0.05 in comparison with a corresponding non-sensitized group (paired Mann–Whitney U test)
Fig. 9
Fig. 9
Flow cytometry analysis of changes in mean fluorescence intensity (MFI) of substance P (SP) in mouse blood leukocytes. a Representative graphs of the changes in mean fluorescence intensity (MFI) of SP in (A) basophils (CD49b+FcεRIα+), (B) monocytes (Ly6C high+CD11b+) and neutrophils (Ly6C dim+CD11b+), and (C) CD8+ T cells. (D), (E), (F), while (G) represents SP+ blood basophils, monocytes, neutrophils and CD8+ T cells in nonsensitized and sensitized mice, respectively. b The median values of MFI of SP+ cells from six different mice. P < 0.05 was considered statistically significant (paired Mann–Whitney U test)
Fig. 10
Fig. 10
Flow cytometry analysis of expression of NK1R in mouse blood leukocytes. a Representative graphs of percentages of NK1R+ leukocytes in the blood of non-sensitized and sensitized mice, respectively. (A) and (D) are fluorescence minus one (FMO) for NK1R; (B) and (E) are all fluorescence (AF) of NK1R+ leukocytes treated with normal saline (NS); (C) and (F) are all fluorescence (AF) of NK1R+ leukocytes treated with SP. b Demonstrates median percentage values of NK1R+ leukocytes in mouse blood. The data shown are the median (range) value from six different mice. *P < 0.05 in comparison with a corresponding non-sensitized group (paired Mann–Whitney U test)
Fig. 11
Fig. 11
Flow cytometry analysis of changes in mean fluorescence intensity (MFI) of NK1R in mouse blood leukocytes. a representative graphs of the changes in mean fluorescence intensity (MFI) of NK1R in (A) basophils (CD49b+FcεRIα+), (B) monocytes (Ly6C high+CD11b+), (C) neutrophils (Ly6C dim+CD11b+), and (D) CD8+ T cells in nonsensitized mice, sensitized mice treated with normal saline (NS) and sensitized mice treated with substance P (SP), respectively. b The median values of MFI of NK1R+ cells from six different mice. P < 0.05 was considered statistically significant (paired Mann–Whitney U test)

Similar articles

Cited by

References

    1. Moreno AS, McPhee R, Arruda LK, Howell MD. Targeting the T helper 2 inflammatory axis in atopic dermatitis. Int Arch Allergy Immunol. 2016;171(2):71–80. doi: 10.1159/000451083. - DOI - PubMed
    1. Nomura T, Kabashima K. Advances in atopic dermatitis in 2015. J Allergy Clin Immunol. 2016;138(6):1548–1555. doi: 10.1016/j.jaci.2016.10.004. - DOI - PubMed
    1. Hijnen D, Knol EF, Gent YY, Giovannone B, Beijn SJ, Kupper TS, Bruijnzeel-Koomen CA, Clark RA. CD8+ T cells in the lesional skin of atopic dermatitis and psoriasis patients are an important source of IFN-γ, IL-13, IL-17, and IL-22. J Investig Dermatol. 2013;133(4):973–979. doi: 10.1038/jid.2012.456. - DOI - PMC - PubMed
    1. Czarnowicki T, Esaki H, Gonzalez J, Malajian D, Shemer A, Noda S, Talasila S, Berry A, Gray J, Becker L, et al. Early pediatric atopic dermatitis shows only a cutaneous lymphocyte antigen (CLA)(+) TH2/TH1 cell imbalance, whereas adults acquire CLA(+) TH22/TC22 cell subsets. J Allergy Clin Immunol. 2015;136(4):941–951. doi: 10.1016/j.jaci.2015.05.049. - DOI - PMC - PubMed
    1. Roesner LM, Heratizadeh A, Wieschowski S, Mittermann I, Valenta R, Eiz-Vesper B, Hennig C, Hansen G, Falk CS, Werfel T. α-NAC-specific autoreactive CD8+ T cells in atopic dermatitis are of an effector memory type and secrete IL-4 and IFN-γ. J Immunol. 2016;196(8):3245–3252. doi: 10.4049/jimmunol.1500351. - DOI - PubMed

Publication types

MeSH terms