. 2017 May 16;114(20):E3954-E3963.
doi: 10.1073/pnas.1616417114. Epub 2017 May 1.

Pre/pro-B cells generate macrophage populations during homeostasis and inflammation

Affiliations

Pre/pro-B cells generate macrophage populations during homeostasis and inflammation

Tatsiana Audzevich et al. Proc Natl Acad Sci U S A. .

Abstract

Most tissue-resident macrophages (Mφs) are believed to be derived prenatally and are assumed to maintain themselves throughout life by self-proliferation. However, in adult mice we identified a progenitor within bone marrow, early pro-B cell/fraction B, that differentiates into tissue Mφs. These Mφ precursors have non-rearranged B-cell receptor genes and coexpress myeloid (GR1, CD11b, and CD16/32) and lymphoid (B220 and CD19) lineage markers. During steady state, these precursors exit bone marrow, losing Gr1, and enter the systemic circulation, seeding the gastrointestinal system as well as pleural and peritoneal cavities but not the brain. While in these tissues, they acquire a transcriptome identical to embryonically derived tissue-resident Mφs. Similarly, these Mφ precursors also enter sites of inflammation, gaining CD115, F4/80, and CD16/32, and become indistinguishable from blood monocyte-derived Mφs. Thus, we have identified a population of cells within the bone marrow early pro-B cell compartment that possess functional plasticity to differentiate into either tissue-resident or inflammatory Mφs, depending on microenvironmental signals. We propose that these precursors represent an additional source of Mφ populations in adult mice during steady state and inflammation.

Keywords: homeostasis; inflammation; macrophages.


Conflict of interest statement

The authors declare no conflict of interest.

Figures

Fig. 1.
Fig. 1.
Mφs with a potential B-cell origin detected in Mb1-iCre/Rosa26R-YFP reporter mice. (A) Flow cytometric analysis of wild-type C57BL6 mice showing CD19 expression on peritoneal CD11b++F4/80++ Mφs. (B) Equivalent analysis of Mb1-iCre/Rosa26-YFP mice showing the YFP expression pattern in Mφs from various tissues. Representative data are shown for 10 experiments carried out on naive animals. Mac, macrophage.
Fig. 2.
Fig. 2.
YFP+ Mφs in Mb1-iCre/Rosa26R-YFP mice do not arise from mature B cells. (A) ImageStream analysis of naive murine peritoneum. Dot plots showing single focused cells in CD11b++F4/80++ Mφ gate identifying three Mφ populations: CD19YFP, CD19YFP+, and CD19+YFP+; the non-Mφ (CD11b+/−F4/80) compartment contains CD19+YFP+ B cells. (B, Upper) Representative images of CD11b++F4/80++ Mφ populations and B cells. (Lower) Although confirming the presence of Mφs coexpressing CD11b, F4/80, YFP, and CD19, ImageStream reveals that a substantial number of doublets occur within rare populations of CD19+YFP+ Mφs; approximately 16.74% of the cells within CD19+YFP+ Mφ gate are single biphenotypic cells. (C) Detection of V-DJ rearrangements and expression of B-cell– and Mφ-specific genes in single and multiple cells purified by FACS. At least 45 single and multiple (20/10/5) cells of each type, including peritoneal B-1/B-2 B cells and CD11b++F4/80++ Mφ populations (CD19YFP, CD19YFP+, and CD19+YFP+) were analyzed for the presence of V-DJ rearrangements in genomic DNA, B-cell–specific Cd79b transcripts, and Mφ-specific Emr1 transcripts. The frequency of V-DJ+ reactions shown below the graph demonstrates that, despite coexpression of Cd79b and Emr1 in intermediate CD19+YFP+ Mφs, the number of V-DJ+ reactions detected on the single-cell level is low compared with B cells (15/45 versus 32/45). The number of V-DJ+ reactions increased to B-cell levels (38/45) when multiple cells (20/10/5) of CD19+YFP+ Mφs were analyzed per reaction; these results suggest contamination by B cells.
Fig. 3.
Fig. 3.
Evaluations of B-cell–specific reporter mice point toward an early pro-B-cell origin of YFP+ Mφs. Cells and tissues from Mb1-iCre/Rosa26-YFP mice (Mb1-iCre), CD19-Cre/Rosa26-YFP mice (CD19-Cre), Rag2−/−/Mb1-iCre/Rosa26-YFP mice (Rag2−/−/ Mb1-iCre), Cr2-Cre/Rosa26-YFP mice (Cr2-Cre), and Rosa26-YFP mice were collected and analyzed by flow cytometry. (A) Representative dot plots showing induction of YFP expression at later B-cell bone marrow developmental stages in CD19-Cre/Rosa26-YFP mice (CD19-Cre) than in Mb1-iCre/Rosa26-YFP mice (Mb1-iCre). B shows little YFP expression in Cd19-Cre and CD21 (Cr2-Cre) reporter strains, but expression in Rag2+/+/Mb1-iCre/Rosa26-YFP mice. For the gating strategy see SI Appendix, Fig. S4.1 for representative dot plots showing YFP expression in peritoneal CD19+ B cells and CD11b++F4/80++ Mφs in the mouse strains named above. Fr, fraction; Mac, macrophage.
Fig. 4.
Fig. 4.
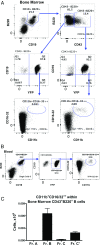
(A and B) Biphenotypic populations of CD19+B220+CD43+YFP+CD16/32++CD11b+ cells with B-lymphoid and myeloid characteristics identified in bone marrow (A) and blood (B). These cells are referred to as “pB-Mφprecursors.” (C) Quantification of CD19+B220+CD43+YFP+CD16/32++CD11b+ pB-Mφprecursors in early B-cell bone marrow fractions. Values are expressed as the absolute number of cells per one limb. Fr, fraction.
Fig. 5.
Fig. 5.
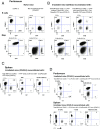
YFP+ Mφs are generated from biphenotypic B220+CD43+CD19+ YFP+CD16/32++ CD11b+ pro-B-cell–derived precursors in response to inflammation. Inflammation was induced by i.p. injection of 0.1 mg zymosan. Tissues were collected at various time points after peritonitis induction and were analyzed by flow cytometry. (A) Gating strategy showing the identification of B220+-CD19+ B cells, B220+-CD19+CD16/32++CD11b++ peritoneal pB-Mφprecursors, YFPB220CD19F4/80++CD16/32++CD11b++ Mφs, and YFP+B220CD19F4/80++CD16/32++CD11b++ pB-Mφs in naive peritoneum. (B) Dot plots showing the B220+-CD19+ B peritoneal compartment with an increased proportion of CD16/32++CD11b++ pB-Mφprecursors and the B220CD19 compartment with a reduced frequency of F4/80++CD11b++ Mφs at 4 h after peritonitis induction. (C) Temporal profiles of peritoneal Mφs, pB-Mφs, and peritoneal pB-Mφprecursors during inflammation. (D) Cell-surface markers for the cells over time. (E and F) Temporal profiles of pB-Mφprecursors in bone marrow (E) and peripheral blood (F) during inflammation. Values are expressed as the percentage of total bone marrow or blood cells. Statistical evaluation was performed by one-way ANOVA using Bonferroni posttest (*P < 0.05, **P < 0.01, ***P < 0.001). BM, bone marrow; MFI, mean fluorescence intensity.
Fig. 6.
Fig. 6.
In vitro assays for pro-B-cell–derived precursors’ differentiation. (A) Results of an in vitro assay in which single-cell populations were cultured for 10–14 d in medium supporting either myeloid or lymphoid growth. Results are shown as the number of events bearing either a lymphoid or myeloid phenotype in the respective media, as explained in Materials and Methods. (B) FACS-purified peritoneal Mφs and pB-Mφprecursors 4 h after peritonitis induction were cultured with or without M-CSF/GM-CSF and were analyzed by cell morphology using Rapid-Romanowsky stain and α-CD19, α-F4/80, and DAPI labeling. (Scale bars, 20 µm.) (C) Cell size was quantified using ImageJ. Statistical evaluation was performed by one-way ANOVA using Bonferroni posttest (*P < 0.05, **P < 0.01, ***P < 0.001). ND, not detected; n.s., not significant.
Fig. 7.
Fig. 7.
pB-Mφprecursors within the early pro-B-cell bone marrow fraction reconstitute peritoneal Mφs in lethally irradiated mice. FACS-purified early pro-B cells containing YFP+CD16/32++CD11b biphenotypic pB-Mφprecursors and mature B cells (control) from the bone marrow of Mb1- iCre/Rosa26-YFP mice (SI Appendix, Fig. S6.1) were mixed in a 1:10 ratio with total bone marrow cells from congenic CD45.1 donor mice and were injected i.v. into lethally irradiated (950 rad) wild-type mice. Hematopoietic reconstitution was assessed in the peritoneum and spleen 6 wk after the injection of donor bone marrow cells. (A and B) Representative plots showing the expression of tracing markers on peritoneal cell populations of naive CD45.1 and Mb1-iCre/Rosa26-YFP mice (A) and the engraftment of donor CD45.1+ (all lineages) and YFP+ (early pro-B/mature B) cells in the peritoneum of lethally irradiated mice (B). (C) Analysis of the reconstitution of hematopoietic lineages in spleen shows engraftment of CD45.1+ progenitors in B and T cells and in the myeloid compartment, whereas YFP+ early pro-B cells contribute exclusively to the reconstitution of the B-cell lineage and do not differentiate into myeloid or T cells. (D) LinIL7Rα+Sca-1++c-Kit++ CLPs containing YFP+ CLPs were mixed with total bone marrow cells from congenic CD45.1 donor mice and were injected into irradiated wild-type mice. Engraftment was determined in the peritoneal B-cell and myeloid compartments as well as in the spleen. BM, bone marrow.
Fig. 8.
Fig. 8.
Pro-B-cell–derived Mφs possess transcriptome profiles similar to those of their embryonic and monocyte-derived counterparts. (A) Inflammation was induced in Mb-1.iCre/Rosa26-YFP mice by i.p. injection of 0.1 mg zymosan. Flow cytometry reveals YFP embryonic MφsTR-naive (P1) and YFP+ pro-B-cell–derived pB-MφsTR-naive (P2) in naive peritoneum. PHK-Red injected before peritonitis labels resident phagocytes and reveals four CD11b++F4/80++ Mφ subsets at resolution (72 h): YFP resident [embryonic, YFPPKH+ (MφsTR-inflam)] (P3) and YFP inflammation-induced Mφs [monocyte-derived, YFPPKH (mo-Mφsinflam)] (P4) along with two groups of pro-B-cell–derived YFP+ Mφs generated during homeostasis, namely resident pB-Mφs [YFP+PKH+ (pB-MφsTR-inflam)] (P5) and inflammation-induced pB-Mφs [YFP+PKH (pB-Mφsinflam)] (P6). The software tool BioLayout Express3D was used for the visualization and analysis of Illumina Mus musculus 6v2 microarray data, which were variance stabilized (VST) and robust spline normalized (RSN) using the lumi R/BioConductor package. Correlation networks, sample comparisons, and identification of coexpression modules were performed in BioLayout Express3D for 30 datasets (n = 3 per group). (B) Diagram of sample similarity analysis showing cell type-specific clustering of datasets. Analysis was performed using a Pearson correlation threshold of r ≥0.97 and the Markov clustering (MCL) algorithm with an inflation value of 3.0. Individual clusters of nodes (samples) were arbitrarily assigned a color. (C) Network graph generated using a Pearson correlation threshold of r ≥0.95 and MCL clustering algorithm with an inflation value of 1.7 shows clusters of genes correlating in their expression profiles and includes clusters of genes with similar function and/or genes with cell-specific expression pattern. SI Appendix, Table S1 provides the content of each of these clusters.

References

    1. Ginhoux F, Jung S. Monocytes and macrophages: Developmental pathways and tissue homeostasis. Nat Rev Immunol. 2014;14:392–404. - PubMed
    1. Gordon S, Taylor PR. Monocyte and macrophage heterogeneity. Nat Rev Immunol. 2005;5:953–964. - PubMed
    1. Bain CC, et al. Resident and pro-inflammatory macrophages in the colon represent alternative context-dependent fates of the same Ly6Chi monocyte precursors. Mucosal Immunol. 2013;6:498–510. - PMC - PubMed
    1. Hoeffel G, et al. C-Myb(+) erythro-myeloid progenitor-derived fetal monocytes give rise to adult tissue-resident macrophages. Immunity. 2015;42:665–678. - PMC - PubMed
    1. Gomez Perdiguero E, et al. Tissue-resident macrophages originate from yolk-sac-derived erythro-myeloid progenitors. Nature. 2015;518:547–551. - PMC - PubMed

Publication types