. 2017 Jun 6;114(23):6056-6061.
doi: 10.1073/pnas.1611855114. Epub 2017 May 1.

Effects of habitat disturbance on tropical forest biodiversity

Affiliations

Effects of habitat disturbance on tropical forest biodiversity

John Alroy. Proc Natl Acad Sci U S A. .

Abstract

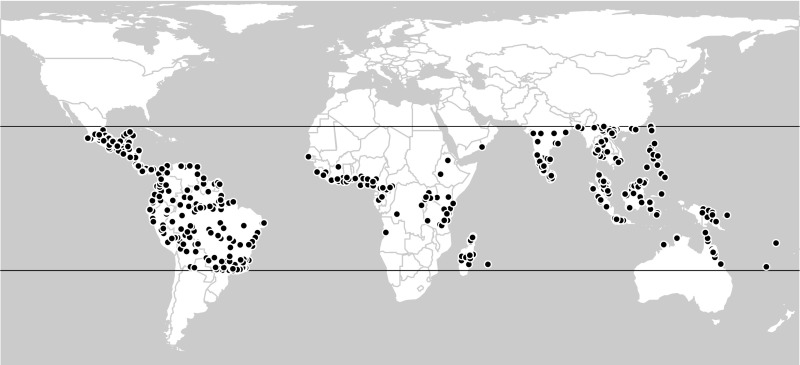
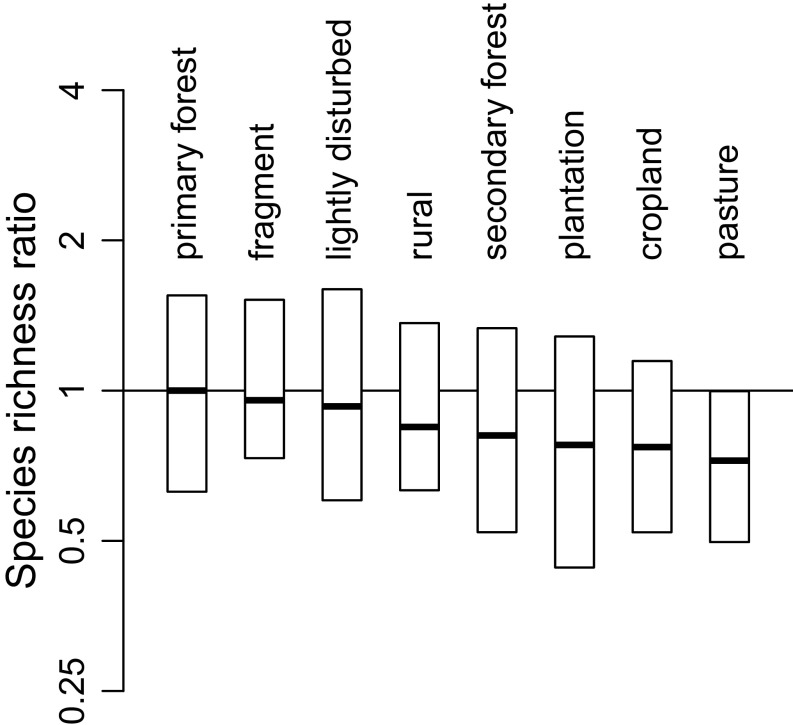
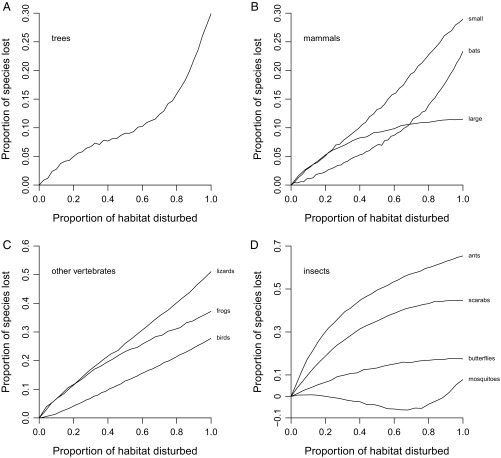
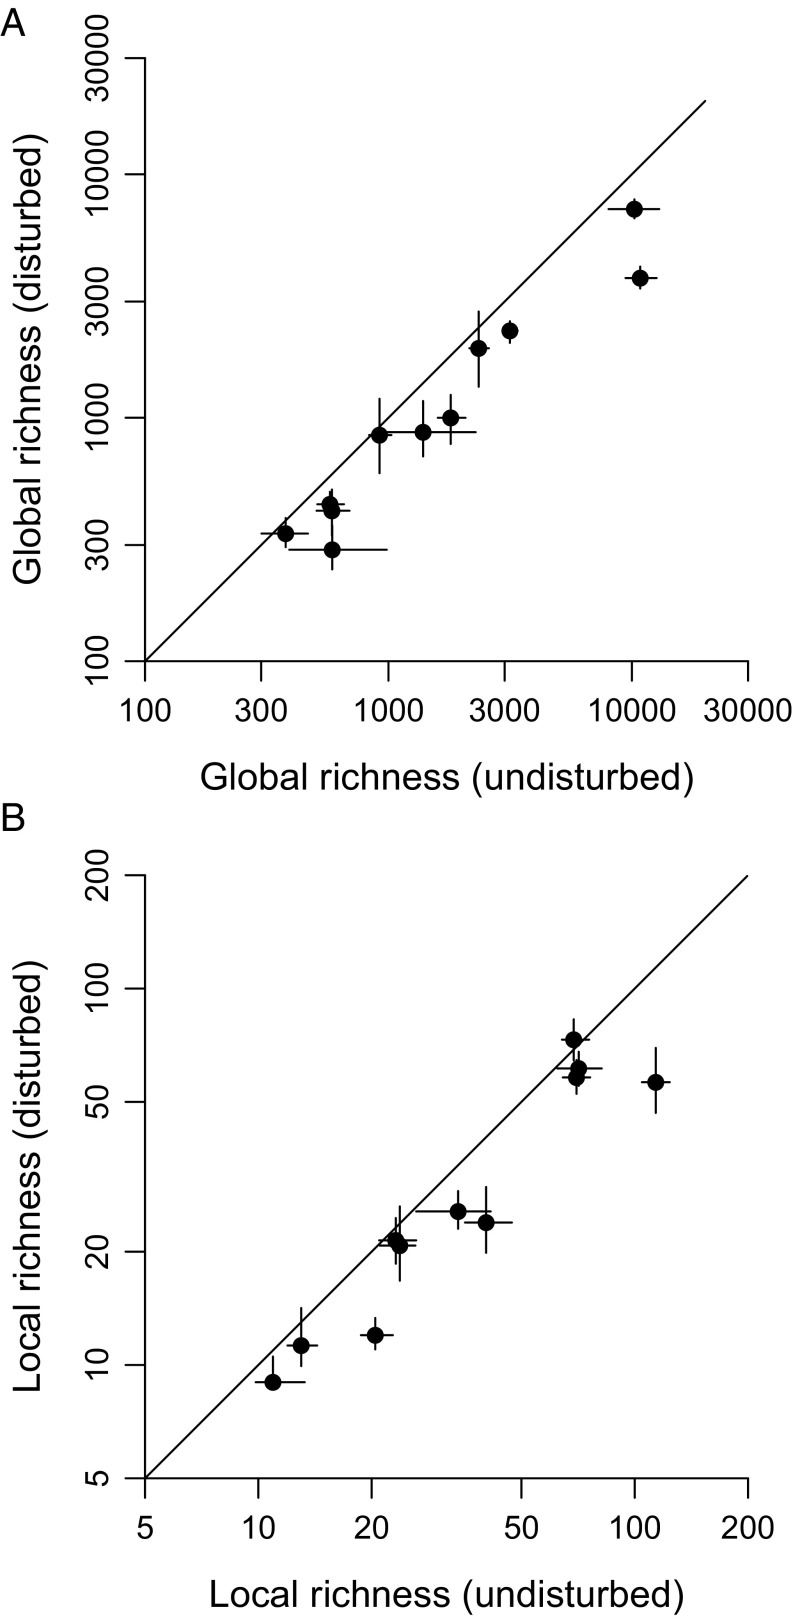
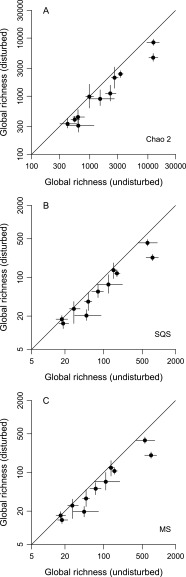
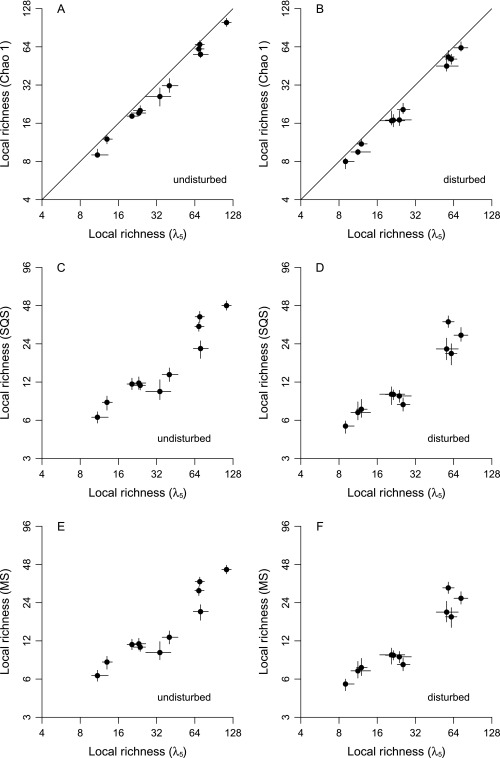
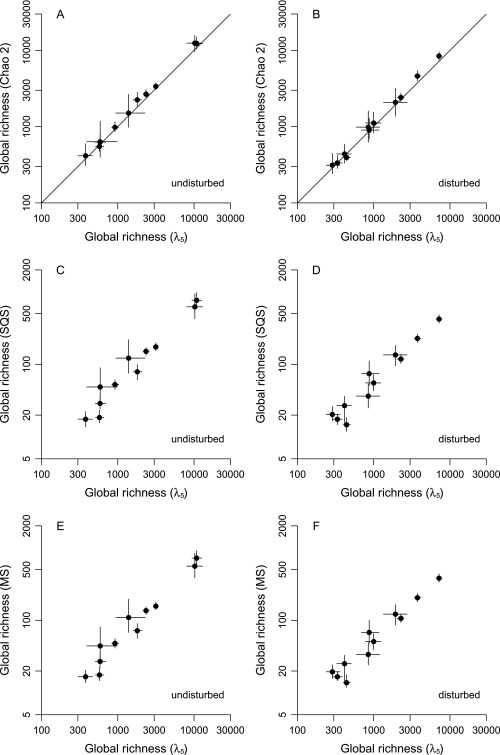
It is widely expected that habitat destruction in the tropics will cause a mass extinction in coming years, but the potential magnitude of the loss is unclear. Existing literature has focused on estimating global extinction rates indirectly or on quantifying effects only at local and regional scales. This paper directly predicts global losses in 11 groups of organisms that would ensue from disturbance of all remaining tropical forest habitats. The results are based on applying a highly accurate method of estimating species richness to 875 ecological samples. About 41% of the tree and animal species in this dataset are absent from disturbed habitats, even though most samples do still represent forests of some kind. The individual figures are 30% for trees and 8-65% for 10 animal groups. Local communities are more robust to disturbance because losses are partially balanced out by gains resulting from homogenization.

Keywords: deforestation; lambda-5 index; mass extinction; multiton subsampling; species extinction.


Conflict of interest statement

The author declares no conflict of interest.

Figures

Fig. 1.
Fig. 1.
Spatial distribution of 875 tropical forest samples including either animals or trees that were drawn from the Ecological Register. The tropics of Cancer and Capricorn are indicated. The pattern mirrors the known distribution of field-based research campaigns in the tropics (19), but this dataset is more dispersed than the one used in a recent, related study (8) because the number of consulted references is greater (605 for the tropics alone vs. 284 for the globe).
Fig. 2.
Fig. 2.
Differences in species richness among habitat disturbance categories. The vertical axis is the ratio of the median local-scale richness value in a category to median richness in undisturbed (= primary) forests, as extrapolated using the λ5 equation (Methods). Data are shown on a log scale. Each bar represents the interquartile range for all samples in a category, regardless of the group. Data are standardized before any other calculation by being divided by the group median. Only categories with at least 20 samples are illustrated (Table S1).
Fig. 3.
Fig. 3.
Expected species losses given varying amounts of habitat disturbance. The x axis is the proportion of randomly drawn samples that represent disturbed habitats; the y axis is the proportion of species expected to be lost. Underlying estimates are based on the λ5 equation. (A) Trees. (B) Mammals. All large mammal species were sampled by camera traps; terrestrial species of small mammals were sampled using various kinds of traps. (C) Other vertebrates. (D) Insects.
Fig. 4.
Fig. 4.
Effects of complete habitat disturbance on global and local richness of tropical species. Estimates are based on the λ5 equation; similar patterns are produced by other methods (Figs. S3 and S4). Points are ecological groups. Lines through points indicate 95% CIs based on simultaneous resampling of samples and of species records within samples. Lines of unity are also shown. (A) Global richness in undisturbed and disturbed original forest environments. (B) Local richness in undisturbed and disturbed original forest environments.
Fig. S1.
Fig. S1.
Simulated species losses given different amounts of habitat disturbance, different geographic range sizes, and different numbers of disturbance blocks. The x axis is the proportion of the geographic gradient that is disturbed, with no species surviving in disturbed blocks. Each panel legend indicates the width of the species ranges placed randomly across the unidimensional spatial gradient and the number of disturbance blocks, which are also randomly placed.
Fig. S2.
Fig. S2.
Expected species losses given complete habitat disturbance as a function of the number of samples used to the compute the λ5 estimates. At each point on a given curve, the estimate is based on randomly drawing a fixed number of samples in each of the undisturbed and disturbed categories. (A) Trees. (B) Mammals. (C) Other vertebrates. (D) Insects.
Fig. 5.
Fig. 5.
Effects of complete habitat disturbance on species incidence and dominance within samples. Points are ecological groups. CIs are not shown because they would be minimal, given the large sample sizes. (A) Median incidence of species. Incidence is the proportion of samples that include a particular species. (B) Median dominance within samples. Dominance is the relative abundance of the most common species.
Fig. S3.
Fig. S3.
Effects of complete habitat disturbance on local richness, as estimated using three additional sampling standardization methods (compare with Fig. 4B). Values for undisturbed- and disturbed-habitat samples are shown on the x and y axes, respectively. Points are ecological groups, and lines through points indicate 95% CIs. Lines of unity are shown. (A) Chao 1. (B) Shareholder quorum subsampling (SQS, a.k.a. coverage-based rarefaction) with a quorum of 0.90. (C) Multiton subsampling with a target of 4.
Fig. S4.
Fig. S4.
Effects of complete habitat disturbance on global richness, as estimated using three additional sampling standardization methods (compare with Fig. 4A). See the legend of Fig. S3 for additional details. (A) Chao 2. (B) Shareholder quorum subsampling (a.k.a. coverage-based rarefaction) with a quorum of 0.10. (C) Multiton subsampling with a target of 0.05.
Fig. S5.
Fig. S5.
Comparisons of local richness estimates generated by the λ5 equation (x axes) and three other methods (y axes, with each method corresponding to a row). Separate estimates for samples from undisturbed habitats (Left) and from disturbed habitats (Right) are given. Points are ecological groups, and lines through points indicate 95% CIs. Lines of unity are shown only for Chao 1 because the other methods work through interpolation instead of extrapolation, so average values are not comparable to λ5 values. Shareholder quorum subsampling quorums are 0.90, and multiton targets are 4. (A) Chao 1 (undisturbed data). (B) Chao 1 (disturbed data). (C) Shareholder quorum subsampling (undisturbed data). (D) Shareholder quorum subsampling (disturbed data). (E) Multiton subsampling (undisturbed data). (F) Multiton subsampling (disturbed data).
Fig. S6.
Fig. S6.
Comparisons of global richness estimates generated by the λ5 equation (x axes) and three other methods (y axes). Shareholder quorum subsampling quorums are 0.10, and multiton targets are 0.05. See the legend of Fig. S5 for additional details. (A) Chao 2 (undisturbed data). (B) Chao 2 (disturbed data). (C) Shareholder quorum subsampling (undisturbed data). (D) Shareholder quorum subsampling (disturbed data). (E) Multiton subsampling (undisturbed data). (F) Multiton subsampling (disturbed data).

Comment in

References

    1. Sala OE, et al. Global biodiversity scenarios for the year 2100. Science. 2000;287:1770–1774. - PubMed
    1. Brooks TM, et al. Habitat loss and extinction in the hotspots of biodiversity. Conserv Biol. 2002;16:909–923.
    1. Laurance WF, et al. Averting biodiversity collapse in tropical forest protected areas. Nature. 2012;489:290–294. - PubMed
    1. Feeley KJ, Silman MR. Biotic attrition from tropical forests correcting for truncated temperature niches. Glob Change Biol. 2010;16:1830–1836.
    1. Huey RB, et al. Why tropical forest lizards are vulnerable to climate warming. Proc Biol Sci. 2009;276:1939–1948. - PMC - PubMed

LinkOut - more resources