. 2017 May 16;114(20):E3993-E4001.
doi: 10.1073/pnas.1700109114. Epub 2017 May 1.

Brd4 modulates the innate immune response through Mnk2-eIF4E pathway-dependent translational control of IκBα

Affiliations

Brd4 modulates the innate immune response through Mnk2-eIF4E pathway-dependent translational control of IκBα

Yan Bao et al. Proc Natl Acad Sci U S A. .

Abstract

Bromodomain-containing factor Brd4 has emerged as an important transcriptional regulator of NF-κB-dependent inflammatory gene expression. However, the in vivo physiological function of Brd4 in the inflammatory response remains poorly defined. We now demonstrate that mice deficient for Brd4 in myeloid-lineage cells are resistant to LPS-induced sepsis but are more susceptible to bacterial infection. Gene-expression microarray analysis of bone marrow-derived macrophages (BMDMs) reveals that deletion of Brd4 decreases the expression of a significant amount of LPS-induced inflammatory genes while reversing the expression of a small subset of LPS-suppressed genes, including MAP kinase-interacting serine/threonine-protein kinase 2 (Mknk2). Brd4-deficient BMDMs display enhanced Mnk2 expression and the corresponding eukaryotic translation initiation factor 4E (eIF4E) activation after LPS stimulation, leading to an increased translation of IκBα mRNA in polysomes. The enhanced newly synthesized IκBα reduced the binding of NF-κB to the promoters of inflammatory genes, resulting in reduced inflammatory gene expression and cytokine production. By modulating the translation of IκBα via the Mnk2-eIF4E pathway, Brd4 provides an additional layer of control for NF-κB-dependent inflammatory gene expression and inflammatory response.

Keywords: Brd4; IκBα resynthesis; Mnk2; NF-κB; eIF4E.


Conflict of interest statement

The authors declare no conflict of interest.

Figures
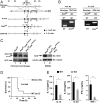
Fig. 1.
Fig. 1.
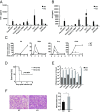
Mice with deletion of Brd4 in myeloid-lineage cells are resistant to LPS-induced septic shock. (A) Schematic representation of the endogenous Brd4 locus, targeting vector, locus following homologous recombination, FLP-mediated deletion of the neomycin resistance cassette, and Cre-mediated deletion of start codon-containing exon 3. (B) Genotyping the allele with loxP sites using the DNA templates isolated from mice tails. The upstream loxP site was amplified with the primers F3 and R3; the 485-bp band indicates the allele with loxP sites, and the 361-bp band indicates the WT allele. The downstream loxP site was amplified with the primers F1 and R1; the 582-bp band indicates the allele with loxP sites, and the 430-bp band indicates the WT allele. (C) The Brd4 KO in macrophages was verified at the protein level with the peripheral macrophages isolated from the peritoneal cavity (Left) and the BMDMs (Right). (D) Mice lacking myeloid Brd4 are more resistant to LPS-induced endotoxic shock than WT mice. Mice (n = 7–10) were monitored for survival after an i.p. challenge with a high dose of LPS (30 mg/kg, Escherichia coli O111:B4). The statistical significance was evaluated using the log-rank test. (E) Brd4 KO decreased the LPS-induced serum levels of IL-12, IL-23, and IFN-γ. ELISA of IL-12, IL-23, and IFN-γ in WT or Brd4-KO mice serum was assessed 2 h (IL-23), 6 h (IL-12), and 16 h (IFN-γ) after i.p. injection with LPS. The statistical significance was evaluated using a t test (*P < 0.05).
Fig. 2.
Fig. 2.
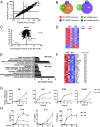
Brd4-CKO mice display decreased LPS-induced lung inflammation and injury. (A) Histological analysis of lungs of WT or Brd4-CKO mice injected with or without LPS (30 mg/kg) for 24 h, assessed by microscopy of sections stained with H&E. (Original magnification, 40×). (B) Decreased LPS-induced neutrophil recruitment in lung tissue of Brd4-CKO mice. WT or Brd4-CKO mice were i.p. injected with or without LPS (5 mg/kg) for 24 h. Lung tissues were isolated to count alveolar macrophages (F4/80+, CD11chigh, CD11blow) and neutrophil (CD11bhigh, Ly6Ghigh) by flow cytometry. (C) Reduced MPO activity in lung tissue of Brd4-CKO mice after LPS treatment. Lung tissues from WT or Brd4-CKO mice were collected after 24 h treatment with LPS (5 mg/kg) to assess MPO activity (n = 6). (D, Left) Reduced apoptosis in lung tissues of Brd4-CKO mice after LPS treatment. TUNEL assay of lung sections from mice i.p. injected with LPS (30 mg/kg) for 24 h. (Right) Numbers of apoptotic cells were counted from lung tissues of the LPS-treated WT or Brd4-CKO mice. Data represent the average of TUNEL-positive cells in each microscope area at a magnification of 20×; at least 10 fields were counted per section. (E) Real-time PCR analysis of Il12b, Ifng, Il17a, and Ccl17 expression in lung tissues from WT and Brd4-CKO mice treated or not treated with LPS (30 mg/kg) for 6 h. Results are presented relative to those of untreated WT mice. Data are representative of two independent experiments. ns, not significant. *P < 0.05, **P < 0.01, ****P < 0.0001.
Fig. 3.
Fig. 3.
(A and B) Brd4-deficient BMDMs secreted less TNF-α (A) and IL-6 (B) after stimulation with various TLR agonists. BMDMs from WT or Brd4-CKO mice were stimulated with TLR1–9 agonists for 24 h. The levels of TNF-α and IL-6 in the media were determined by ELISA. (C) BMDMs of WT and Brd4-CKO mice were infected with GBS, and the expression of the indicated genes was analyzed by RT-PCR. Data are representative of three independent experiments. (D) Brd4-CKO mice were more susceptible to GBS infection. The Kaplan–Meier survival curves of mice infected with 2,000 cfu of GBS (n = 8) were measured. The statistical significance was evaluated using a log-rank test. Data are representative of two independent experiments. (E) After infected with GBS (2,000 cfu) for 24 h, the bacterial load in mouse tissues was determined by measuring cfu of the surviving bacteria. Data are presented as cfu per gram of tissue or milliliter of blood. (F, Left) WT and Brd4-CKO mice were infected with GBS (2,000 cfu) for 24 h, and lung tissues were assessed by H&E staining. (Right) The inflammation scores of the lung tissues. *P < 0.05, **P < 0.01.
Fig. 4.
Fig. 4.
Deletion of Brd4 alters the expression of a subset of LPS-regulated genes. (A) A fold change versus fold change (Fc/Fc) scatter plot comparing the LPS-stimulated change in gene expression in WT macrophage and Brd4-deficient BMDMs. The ratio of expression for each probe set and for each comparison are plotted on the x and y axes, respectively (fold change, logarithmic scale). (B) Genes were classified according to expression changes in WT BMDMs in response to LPS stimulation. Venn diagrams display the number of genes in each category and, within each category, the number of genes that were induced or suppressed by deletion of Brd4 at the 4-h time point after LPS treatment. (C) Volcano scatter plot comparing KO versus WT microarray expression datasets after 4-h LPS treatment. (D) Heat map representation of the relative expression level (scaled Z-score) based on log2-normalized expression levels of genes with expression changes larger than twofold between WT and KO BMDMs after 4-h LPS treatment. (E) Functional cluster of genes with expression changes larger than twofold between WT and KO BMDMs after 4 h LPS treatment. DAVID was used to perform functional enrichment analysis with the functional annotation clustering tool. Annotation clusters were described with selected (most descriptive) annotations, and the top selected annotation clusters are presented. (F) Heat map representation of the relative expression level (scaled Z-score) of immune system process-related genes clustered in Fig. 4E. Fold-change values of KO versus WT are listed. (G and H) BMDMs of WT and Brd4-KO mice were stimulated with LPS (100 ng/mL). The expression of the indicated genes was analyzed by RT-PCR (G), and the levels of the indicated proteins in culture media were analyzed by ELISA (H). Data are representative of three independent experiments.
Fig. 5.
Fig. 5.
(A) Heat map representation of relative expression level (scaled Z-score) of the LPS-suppressed genes whose expression was up-regulated in the Brd4-deficient BMDMs after LPS stimulation. Fold-change values of KO versus WT are listed. (B) WT or Brd4-deficient BMDMs were stimulated with LPS (100 ng/mL) for the indicated period of time, and the expression of Mknk2 was analyzed by real-time PCR. (C) WT or Brd4-deficient BMDMs were stimulated with LPS (100 ng/mL) for the indicated time point, followed by immunoblotting with the indicated antibodies. (D) Representative polysome profiles obtained by sucrose density gradient (10–50%) centrifugation from WT or Brd4-deficient BMDMs after 1 h LPS stimulation. (E) Levels of Nfkbia mRNA from polysomal fractions were analyzed by real-time PCR. Data are representative of three independent experiments. (F) WT or Brd4-deficient BMDMs were stimulated with LPS (100 ng/mL) for 1 h, and the relative levels of Nfkbia mRNA were analyzed by real-time PCR. (G) WT or Brd4-deficient BMDMs were treated with LPS (100 ng/mL) for the indicated time periods, and the cytoplasmic (Cyt.) and nuclear (Nuc.) extracts were immunoblotted for the levels of IκBα and RelA. HDAC1 and tubulin were used as nuclear or cytoplasmic protein controls, respectively. IB, immunoblot. (H) WT or Brd4-deficient BMDMs were stimulated with LPS (100 ng/mL) for the indicated time periods. Whole-cell lysates were prepared, and the DNA-binding activity of NF-κB was assessed by EMSA. (I) WT or Brd4-deficient BMDMs were stimulated with LPS (100 ng/mL) for 1 h, and ChIP assays were performed using antibodies against RelA and RNAPII and probed for the promoters of Il12b, Il23a, and Il6. Results are shown as the mean ± SD of three independent experiments; **P < 0.01, ***P < 0.001. (J) Schematic model for Brd4 regulation of the NF-κB target gene expression via Mnk2–eIF4E pathway-dependent translational control of IκBα resynthesis.
Fig. S1.
Fig. S1.
WT or Brd4-deficient BMDMs were stimulated with LPS (100 ng/mL) for the indicated time periods, and the expression of Mknk1 was analyzed by real-time PCR.
Fig. S2.
Fig. S2.
(A) Densitometry analysis showing band intensity of Mnk2 relative to tubulin. Data are shown as mean ± SEM, n = 4 (*P < 0.05, **P < 0.01). (B) Densitometry analysis showing band intensity of p-Mnk2 relative to total Mnk2. Data are shown as mean ± SEM, n = 3. (C) Densitometry analysis showing band intensity of p-eif4E relative to total eif4E. Data are shown as mean ± SEM, n = 3 (*P < 0.05, **P < 0.01).
Fig. S3.
Fig. S3.
WT or Brd4-deficient BMDMs were stimulated with LPS (100 ng/mL) for the indicated time periods, followed by immunoblotting with the indicated antibodies. IB, immunoblot.
Fig. S4.
Fig. S4.
WT or Brd4-deficient BMDMs were stimulated with LPS (100 ng/mL) for 1 h. Levels of Nfkbib, Nfkbibe, and Bcl-3 mRNA from polysomal fractions were analyzed by real-time PCR. Data are representative of three independent experiments.
Fig. S5.
Fig. S5.
Levels of Nfkbia mRNA isolated from polysomal fractions of unstimulated WT or Brd4-deficient BMDMs were analyzed by real-time PCR.
Fig. S6.
Fig. S6.
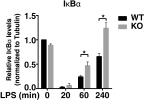
Densitometry analysis showing band intensity of IκBα relative to tubulin. Data are shown as mean ± SEM, n = 3 (*P < 0.05).
Fig. S7.
Fig. S7.
WT or Brd4-deficient BMDMs were stimulated with LPS (100 ng/mL) for the indicated time periods, followed by immunoblotting with the indicated antibodies.
Fig. S8.
Fig. S8.
The relative signal intensity of Mknk2 (A) and Mknk1 (B) in the microarray data described by Nicodeme et al. (20).
Fig. S9.
Fig. S9.
(A) Brd4-deficient BMDMs were or were not pretreated with cercosporamide (1 μM and 5 μM) followed by the stimulation with LPS (100 ng/mL) for the indicated time periods and immunoblotting with the indicated antibodies. (B) Brd4-deficient BMDMs were or were not pretreated with cercosporamide (1 μM and 5 μM) followed by treatment with LPS (100 ng/mL) at the indicated time points. The cytoplasmic (Cyt.) and nuclear (Nuc.) extracts were immunoblotted for the levels of IκBα and RelA. HDAC1 and tubulin were used as nuclear and cytoplasmic protein controls, respectively. (C) Brd4-deficient BMDMs were pretreated or not with cercosporamide (5 μM for Il23a, Il1a, and Cxcl3; 20 μM for Il12b and Il6) followed by stimulation with LPS (100 ng/mL) for 1 h (Il12b and Il6) or 4 h (Il23a, Il1a, and Cxcl3). The expression of indicated genes was analyzed by real-time PCR. For all experiments, the total treatment time of cercosporamide was 5 h.
Fig. S10.
Fig. S10.
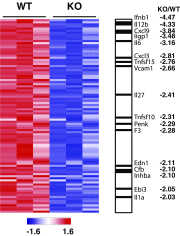
Microarray analysis of genes that were LPS inducible in the WT macrophages and were down-regulated in the KO macrophages compared with WT after LPS stimulation for 4 h, presented as relative expression level (scaled Z-score), based on log2-normalized expression levels (Left), including NF-κB targets (dark boxes, Center). The NF-κB target genes (listed from top to bottom) were Ifnb1, Il12b, Cxcl9, Iigp1, Il6, Cxcl3, Tnfsf15, Vcam1, Il27, Tnfsf10, Penk, F3, Edn1, Cfb, Inhba, Ebi3, and Il1α.

References

    1. Ghosh S, May MJ, Kopp EB. NF-kappa B and Rel proteins: Evolutionarily conserved mediators of immune responses. Annu Rev Immunol. 1998;16:225–260. - PubMed
    1. Baldwin AS., Jr The NF-kappa B and I kappa B proteins: New discoveries and insights. Annu Rev Immunol. 1996;14:649–683. - PubMed
    1. Hayden MS, Ghosh S. Shared principles in NF-kappaB signaling. Cell. 2008;132:344–362. - PubMed
    1. Chen LF, Greene WC. Shaping the nuclear action of NF-kappaB. Nat Rev Mol Cell Biol. 2004;5:392–401. - PubMed
    1. Smale ST. Hierarchies of NF-κB target-gene regulation. Nat Immunol. 2011;12:689–694. - PMC - PubMed

Publication types

MeSH terms