

Heterogeneity and scale of sustainable development in cities
- PMID: 28461489
- PMCID: PMC5576773
- DOI: 10.1073/pnas.1606033114
Heterogeneity and scale of sustainable development in cities
Abstract
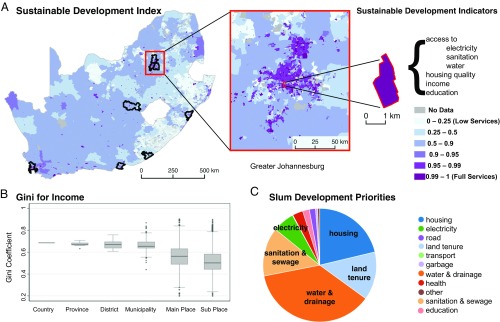
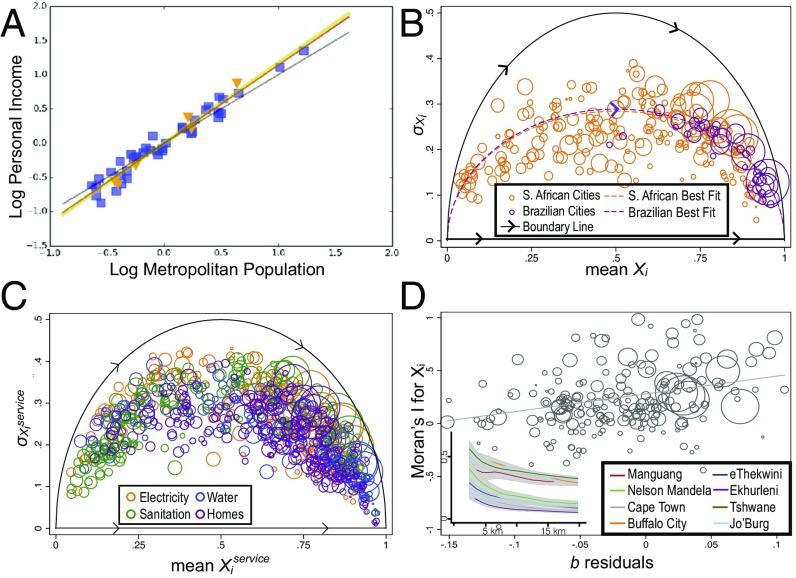
Rapid worldwide urbanization is at once the main cause and, potentially, the main solution to global sustainable development challenges. The growth of cities is typically associated with increases in socioeconomic productivity, but it also creates strong inequalities. Despite a growing body of evidence characterizing these heterogeneities in developed urban areas, not much is known systematically about their most extreme forms in developing cities and their consequences for sustainability. Here, we characterize the general patterns of income and access to services in a large number of developing cities, with an emphasis on an extensive, high-resolution analysis of the urban areas of Brazil and South Africa. We use detailed census data to construct sustainable development indices in hundreds of thousands of neighborhoods and show that their statistics are scale-dependent and point to the critical role of large cities in creating higher average incomes and greater access to services within their national context. We then quantify the general statistical trajectory toward universal basic service provision at different scales to show that it is characterized by varying levels of inequality, with initial increases in access being typically accompanied by growing disparities over characteristic spatial scales. These results demonstrate how extensions of these methods to other goals and data can be used over time and space to produce a simple but general quantitative assessment of progress toward internationally agreed sustainable development goals.
Keywords: inequality; neighborhoods; slums; spatial correlations; urban services.
Conflict of interest statement
The authors declare no conflict of interest.
Figures
References
-
- Montgomery MR. The urban transformation of the developing world. Science. 2008;319:761–764. - PubMed
-
- UN-Habitat 2012 State of the World’s Cities 2012/2013, Prosperity of Cities. Available at mirror.unhabitat.org/pmss/listItemDetails.aspx?publicationID=3387.
-
- Solecki W, Seto KC, Marcotullio PJ. It’s time for an urbanization science. Environ Sci Policy Sustain Dev. 2013;55:12–17.
-
- Bettencourt L, West G. A unified theory of urban living. Nature. 2010;467:912–913. - PubMed
-
- Kennedy CM. The Evolution of Great World Cities: Urban Wealth and Economic Growth. Univ of Toronto Press; Toronto: 2011.
Publication types
LinkOut - more resources
Full Text Sources
Other Literature Sources
