

The effect of vitreomacular and cataract surgery on oxygen saturation in retinal vessels
- PMID: 28461738
- PMCID: PMC5408942
- DOI: 10.2147/OPTH.S132392
The effect of vitreomacular and cataract surgery on oxygen saturation in retinal vessels
Abstract
Purpose: To evaluate the effects of vitreomacular and cataract surgery on retinal oximetry in vitreomacular disease.
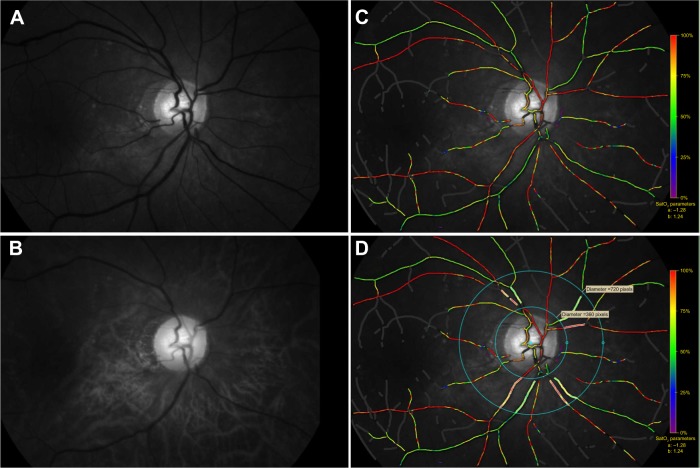
Patients and methods: Thirty-eight eyes with epiretinal membrane (ERM) and 15 with idiopathic macular hole (MH) underwent 25 gauge pars plana vitrectomy combined with cataract surgery and intraocular lens implantation. Retinal oximetry was performed using the Oxymap T1 before, 1 month, and 6 months after surgery. Oxymap T1 simultaneously captures monochrome images of the fundus at two different wavelengths of light. Built-in Oxymap Analyzer software measures the oxygen saturation and vessel diameter.
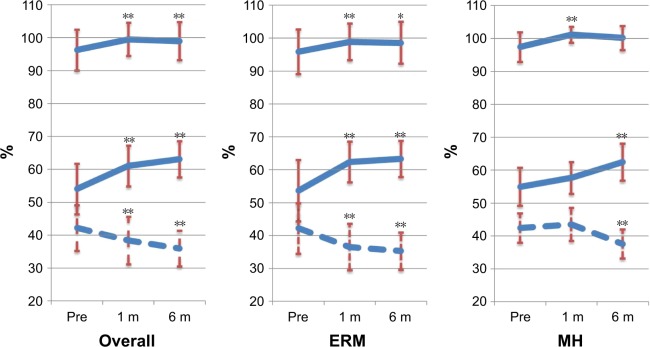
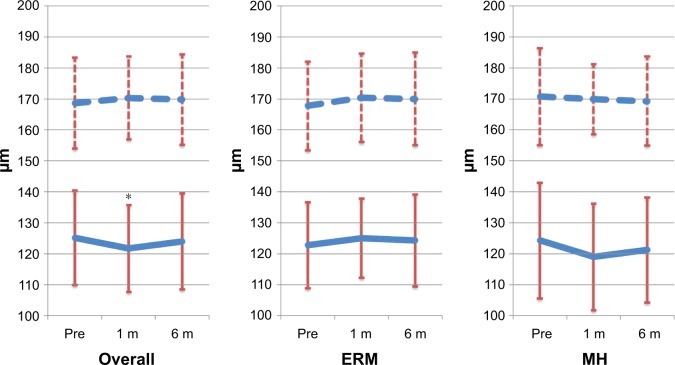
Results: Mean arterial oxygen saturation significantly increased from 96.8%±6.2% to 100.2%±5.8% at 1 month and to 99.6%±5.8% at 6 months after surgery (P<0.01). Mean venous oxygen saturation also significantly increased from 54.6%±7.5% to 61.2%±6.4% at 1 month and to 62.6%±5.9% at 6 months after surgery (P<0.01). Mean arteriovenous (A-V) difference decreased from 42.2%±6.6% to 39.0%±7.8% at 1 month and to 37.0%±6.9% at 6 months after surgery (P<0.01). The ERM and MH groups showed similar changes in retinal oxygen saturation. However, there were no significant changes in the caliber of major retinal vessels after surgery (from 125.2±15.2 μm to 124.0±15.4 μm in artery, from 168.7±14.6 μm to 169.8±14.6 μm in vein).
Conclusion: Oxymap T1 was able to measure the increase in oxygen saturation in retinal arteries and veins, which led to a decrease in the A-V difference in oxygen saturation after vitrectomy combined with cataract surgery.
Keywords: oxygen saturation; retinal vessels; vitrectomy; vitreomacular disease.
Conflict of interest statement
Disclosure A Tsujikawa reports conflicts of interest (financial disclosures) from Pfizer, Bayer, Santen, Novartis, Senju, Alcon, Nidek, AMO Japan, and Japan Society for the Promotion of Science. The other authors report no conflicts of interest in this work.
Figures
Similar articles
-
The influence of retinal oxygen saturation and choroidal volume on postoperative outcomes in patients with epiretinal membrane.Acta Ophthalmol. 2022 May;100(3):e743-e752. doi: 10.1111/aos.14966. Epub 2021 Aug 15. Acta Ophthalmol. 2022. PMID: 34396704 Free PMC article.
-
The effect of pars plana vitrectomy and nuclear cataract on oxygen saturation in retinal vessels, diabetic and non-diabetic patients compared.Acta Ophthalmol. 2016 Feb;94(1):41-7. doi: 10.1111/aos.12828. Epub 2015 Aug 27. Acta Ophthalmol. 2016. PMID: 26310901
-
The effect of pars plan vitrectomy on oxygen saturation in retinal vessels--a pilot study.Acta Ophthalmol. 2014 Jun;92(4):328-31. doi: 10.1111/aos.12238. Epub 2013 Jul 15. Acta Ophthalmol. 2014. PMID: 23848230
-
Retinal oximetry and systemic arterial oxygen levels.Acta Ophthalmol. 2018 Nov;96 Suppl A113:1-44. doi: 10.1111/aos.13932. Acta Ophthalmol. 2018. PMID: 30460761 Review.
-
THE EFFECT OF INTERNAL LIMITING MEMBRANE PEELING ON IDIOPATHIC EPIRETINAL MEMBRANE SURGERY, WITH A REVIEW OF THE LITERATURE.Retina. 2017 May;37(5):873-880. doi: 10.1097/IAE.0000000000001263. Retina. 2017. PMID: 27617536 Review.
Cited by
-
Retinal oximetry: new insights into ocular and systemic diseases.Graefes Arch Clin Exp Ophthalmol. 2025 Apr 21. doi: 10.1007/s00417-025-06831-8. Online ahead of print. Graefes Arch Clin Exp Ophthalmol. 2025. PMID: 40254630 Review.
-
Vitrectomy for macular edema due to retinal vein occlusion.Clin Ophthalmol. 2019 Jun 13;13:969-984. doi: 10.2147/OPTH.S203212. eCollection 2019. Clin Ophthalmol. 2019. PMID: 31354231 Free PMC article.
-
Cataract significantly influences quantitative measurements on swept-source optical coherence tomography angiography imaging.PLoS One. 2018 Oct 2;13(10):e0204501. doi: 10.1371/journal.pone.0204501. eCollection 2018. PLoS One. 2018. PMID: 30278057 Free PMC article.
-
Screening of idiopathic epiretinal membrane using fundus images combined with blood oxygen saturation and vascular morphological features.Int Ophthalmol. 2023 Apr;43(4):1215-1228. doi: 10.1007/s10792-022-02520-1. Epub 2022 Oct 7. Int Ophthalmol. 2023. PMID: 36207566 Free PMC article.
-
The influence of retinal oxygen saturation and choroidal volume on postoperative outcomes in patients with epiretinal membrane.Acta Ophthalmol. 2022 May;100(3):e743-e752. doi: 10.1111/aos.14966. Epub 2021 Aug 15. Acta Ophthalmol. 2022. PMID: 34396704 Free PMC article.
References
-
- Eliasdottir TS, Bragason D, Hardarson SH, Kristjansdottir G, Stefánsson E. Venous oxygen saturation is reduced and variable in central retinal vein occlusion. Graefes Arch Clin Exp Ophthalmol. 2014;253(10):1653–1661. - PubMed
-
- Traustason S, la Cour M, Larsen M. Retinal vascular oximetry during ranibizumab treatment of central retinal vein occlusion. Br J Ophthalmol. 2014;98(9):1208–1211. - PubMed
-
- Stefánsson E. Physiology of vitreous surgery. Graefes Arch Clin Exp Ophthalmol. 2009;247(2):147–163. - PubMed
-
- Williamson TH, Grewal J, Gupta B, Mokete B, Lim M, Fry CH. Measurement of PO2 during vitrectomy for central retinal vein occlusion, a pilot study. Graefes Arch Clin Exp Ophthalmol. 2009;247(8):1019–1023. - PubMed
-
- Hardarson SH. Retinal oximetry. Acta Ophthalmol. 2013;91(Thesis 2):1–47. - PubMed
LinkOut - more resources
Full Text Sources
Other Literature Sources
Miscellaneous
