

Glacial allopatry vs. postglacial parapatry and peripatry: the case of hedgehogs
- PMID: 28462018
- PMCID: PMC5407276
- DOI: 10.7717/peerj.3163
Glacial allopatry vs. postglacial parapatry and peripatry: the case of hedgehogs
Abstract
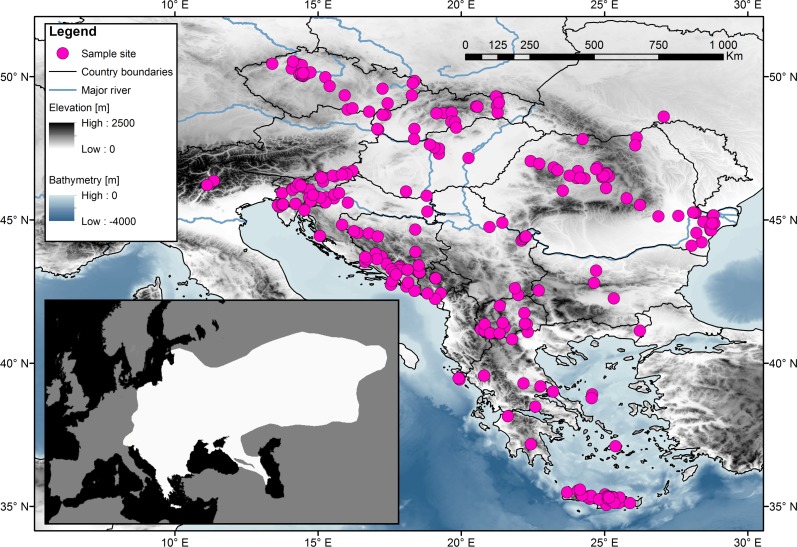
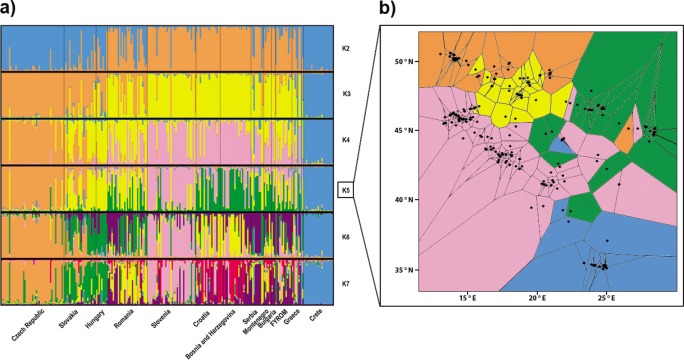
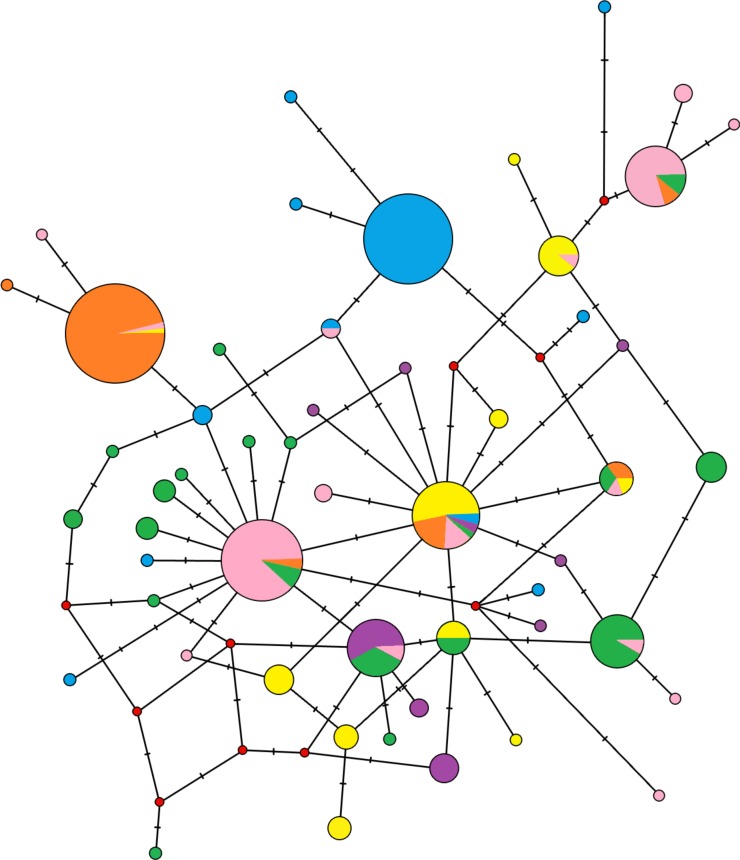
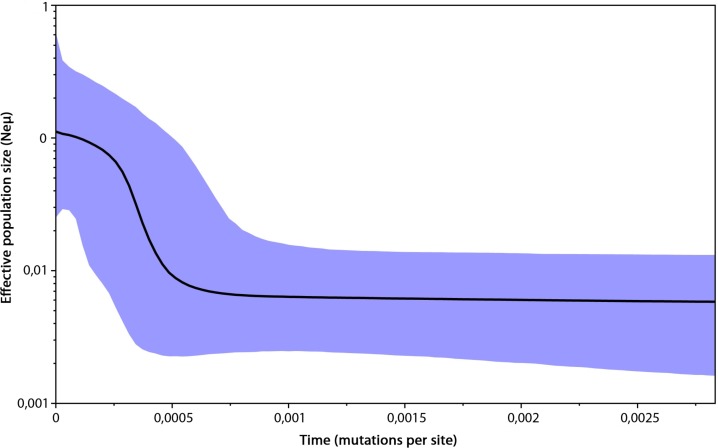
Although hedgehogs are well-known examples of postglacial recolonisation, the specific processes that shape their population structures have not been examined by detailed sampling and fast-evolving genetic markers in combination with model based clustering methods. This study aims to analyse the impacts of isolation within glacial refugia and of postglacial expansion on the population structure of the Northern White-breasted hedgehog (Erinaceus roumanicus). It also discusses the role of the processes at edges of species distribution in its evolutionary history. The maternally inherited mitochondrial control region and the bi-parentally inherited nuclear microsatellites were used to examine samples within the Central Europe, Balkan Peninsula and adjacent islands. Bayesian coalescent inference and neutrality tests proposed a recent increase in the population size. The most pronounced pattern of population structure involved differentiation of the insular populations in the Mediterranean Sea and the population within the contact zone with E. europaeus in Central Europe. An interspecies hybrid was detected for the first time in Central Europe. A low genetic diversity was observed in Crete, while the highest genetic distances among individuals were found in Romania. The recent population in the post-refugial area related to the Balkan Peninsula shows a complex pattern with pronounced subpopulations located mainly in the Pannonian Basin and at the Adriatic and Pontic coasts. Detailed analyses indicate that parapatry and peripatry may not be the only factors that limit range expansion, but also strong microevolutionary forces that may change the genetic structure of the species. Here we present evidence showing that population differentiation may occur not only during the glacial restriction of the range into the refugia, but also during the interglacial range expansion. Population differentiation at the Balkan Peninsula and adjacent regions could be ascribed to diversification in steppe/forest biomes and complicated geomorphology, including pronounced geographic barriers as Carpathians.
Keywords: Balkan; Erinaceus roumanicus; Founder effect; Genetic differentiation; Interspecies interactions; Landscape genetic; Phylogeography.
Conflict of interest statement
The authors declare there are no competing interests.
Figures
Similar articles
-
Unique postglacial evolution of the hornbeam (Carpinus betulus L.) in the Carpathians and the Balkan Peninsula revealed by chloroplast DNA.Sci Total Environ. 2017 Dec 1;599-600:1493-1502. doi: 10.1016/j.scitotenv.2017.05.062. Epub 2017 May 17. Sci Total Environ. 2017. PMID: 28531958
-
Genetic differentiation of the marbled white butterfly, Melanargia galathea, accounts for glacial distribution patterns and postglacial range expansion in southeastern Europe.Mol Ecol. 2006 Jun;15(7):1889-901. doi: 10.1111/j.1365-294X.2006.02900.x. Mol Ecol. 2006. PMID: 16689905
-
DNA footprints of European hedgehogs, Erinaceus europaeus and E. concolor: Pleistocene refugia, postglacial expansion and colonization routes.Mol Ecol. 2001 Sep;10(9):2187-98. doi: 10.1046/j.0962-1083.2001.01357.x. Mol Ecol. 2001. PMID: 11555261
-
Northern glacial refugia and altitudinal niche divergence shape genome-wide differentiation in the emerging plant model Arabidopsis arenosa.Mol Ecol. 2016 Aug;25(16):3929-49. doi: 10.1111/mec.13721. Epub 2016 Jul 29. Mol Ecol. 2016. PMID: 27288974
-
Microevolution of sympatry: landscape genetics of hedgehogs Erinaceus europaeus and E. roumanicus in Central Europe.Heredity (Edinb). 2012 Mar;108(3):248-55. doi: 10.1038/hdy.2011.67. Epub 2011 Aug 24. Heredity (Edinb). 2012. PMID: 21863052 Free PMC article.
Cited by
-
Evaluating the Impact of Wildlife Shelter Management on the Genetic Diversity of Erinaceus europaeus and E. roumanicus in Their Contact Zone.Animals (Basel). 2020 Aug 20;10(9):1452. doi: 10.3390/ani10091452. Animals (Basel). 2020. PMID: 32825208 Free PMC article.
-
3D Geometric Morphometrics Reveals Convergent Character Displacement in the Central European Contact Zone between Two Species of Hedgehogs (Genus Erinaceus).Animals (Basel). 2020 Oct 4;10(10):1803. doi: 10.3390/ani10101803. Animals (Basel). 2020. PMID: 33020407 Free PMC article.
-
Contrasting levels of hybridization across the two contact zones between two hedgehog species revealed by genome-wide SNP data.Heredity (Edinb). 2022 Nov;129(5):305-315. doi: 10.1038/s41437-022-00567-5. Epub 2022 Oct 13. Heredity (Edinb). 2022. PMID: 36229647 Free PMC article.
-
Application of a SSR-GBS marker system on investigation of European Hedgehog species and their hybrid zone dynamics.Ecol Evol. 2019 Feb 14;9(5):2814-2832. doi: 10.1002/ece3.4960. eCollection 2019 Mar. Ecol Evol. 2019. PMID: 30891219 Free PMC article.
-
Genetic structure of the European hedgehog (Erinaceus europaeus) in Denmark.PLoS One. 2020 Jan 17;15(1):e0227205. doi: 10.1371/journal.pone.0227205. eCollection 2020. PLoS One. 2020. PMID: 31951621 Free PMC article.
References
-
- Amori G, Hutterer R, Kryštufek B, Yigit N, Mitsain G, Palomo LJ. Erinaceus roumanicus. The IUCN Red List of Threatened Species 2016: e.T136344A22325720. 2016 doi: 10.2305/IUCN.UK.2016-3.RLTS.T136344A22325720.en. - DOI
-
- Balkenhol N, Cushman S, Storfer A, Waits L. Landscape genetics: concepts, methods, applications. Wiley-Blackwell; Hoboken: 2015.
-
- Bannikova AA, Lebedev VS, Abramov AV, Rozhnov VV. Contrasting evolutionary history of hedgehogs and gymnures (Mammalia: Erinaceomorpha) as inferred from a multigene study. Biological Journal of Linnean Society. 2014;112:499–519. doi: 10.1111/bij.12299. - DOI
LinkOut - more resources
Full Text Sources
Other Literature Sources
