

Mechanisms underlying the volume regulation of interstitial fluid by capillaries: a simulation study
- PMID: 28462092
- PMCID: PMC5381436
- DOI: 10.1016/j.imr.2015.12.006
Mechanisms underlying the volume regulation of interstitial fluid by capillaries: a simulation study
Abstract
Background: Control of the extracellular fluid volume is one of the most indispensable issues for homeostasis of the internal milieu. However, complex interdependence of the pressures involved in determination of fluid exchange makes it difficult to predict a steady-state tissue volume under various physiological conditions without mathematical approaches.
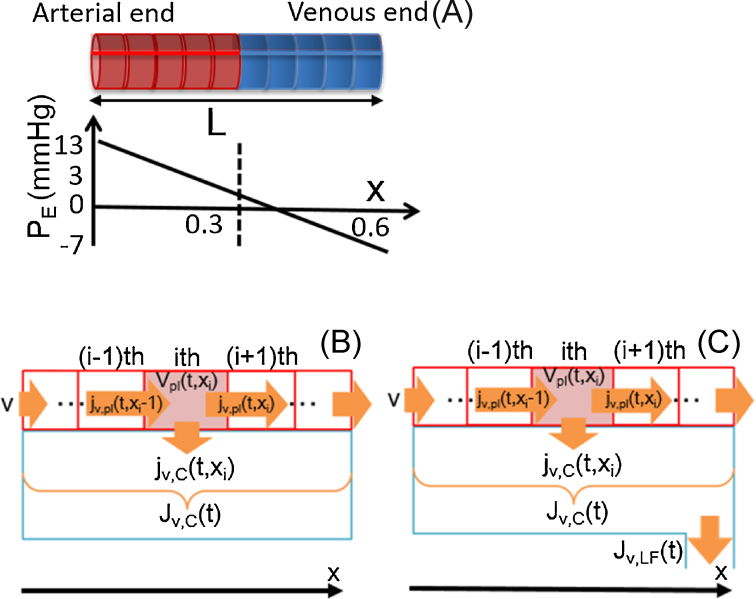
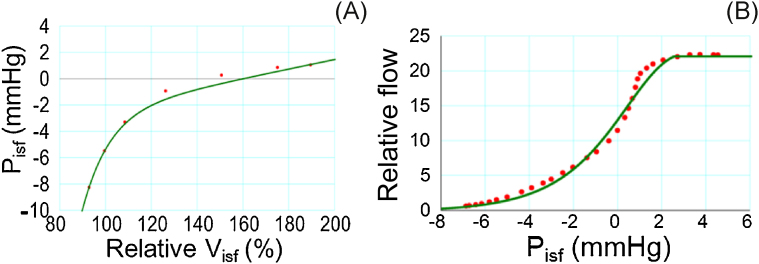
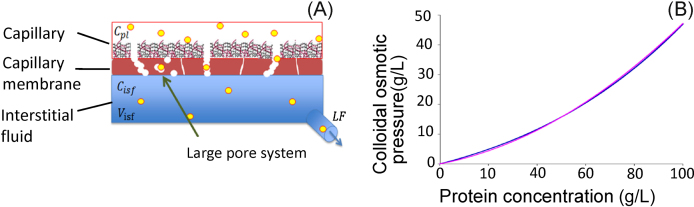
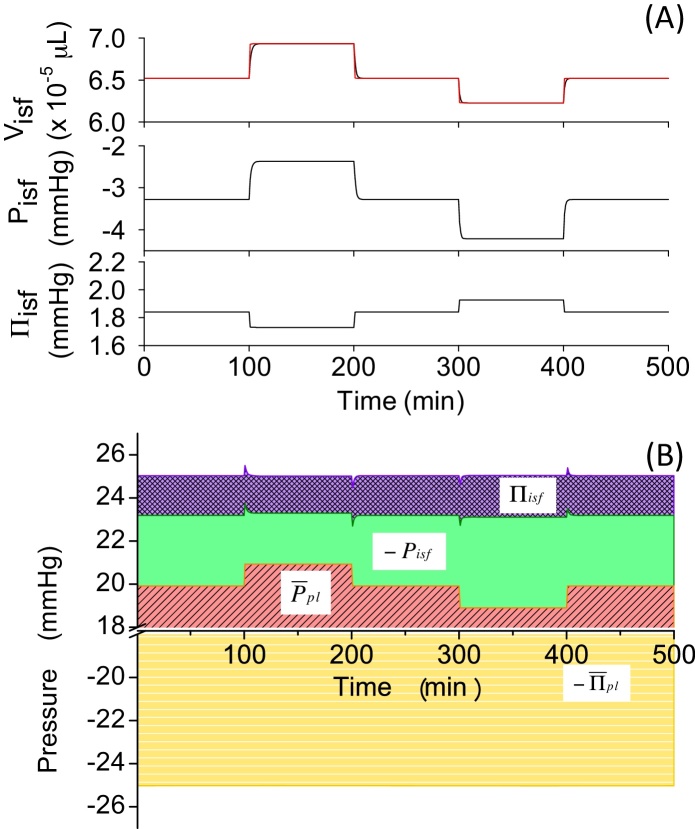
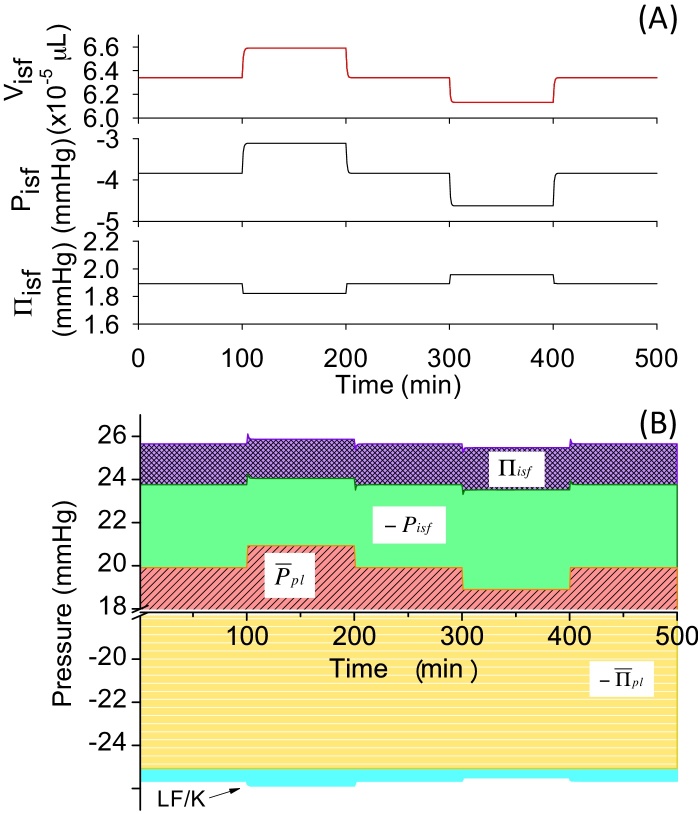
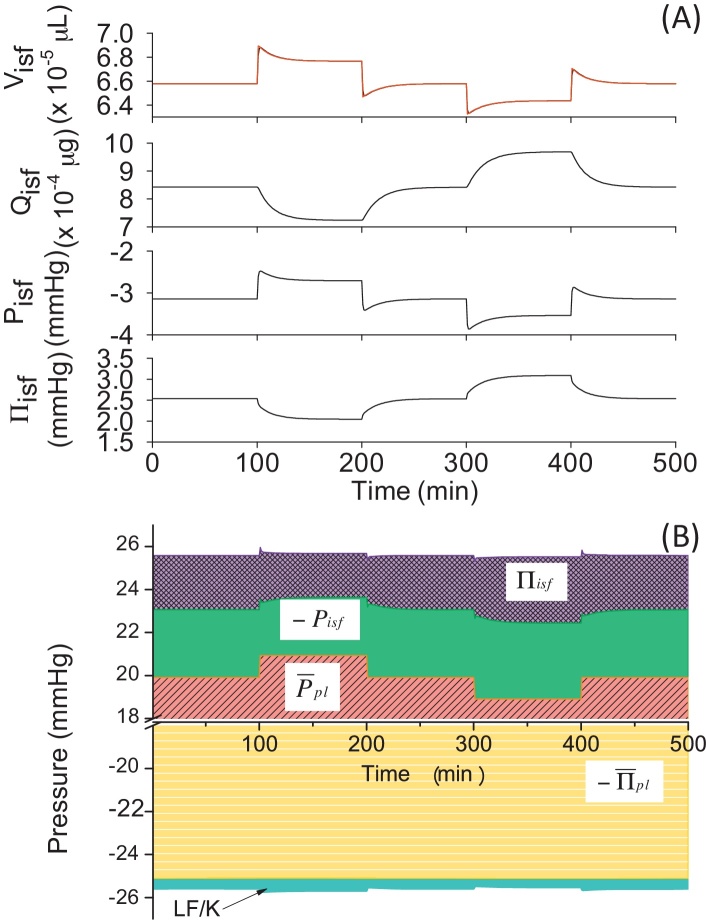
Methods: Here, we developed a capillary model based on the Starling's principle, which allowed us to clarify the mechanisms of the interstitial-fluid volume regulation. Three well known safety factors against edema: (1) low tissue compliance in negative pressure ranges; (2) lymphatic flow driven by the tissue pressure; and (3) protein washout by the lymph, were incorporated into the model in sequence.
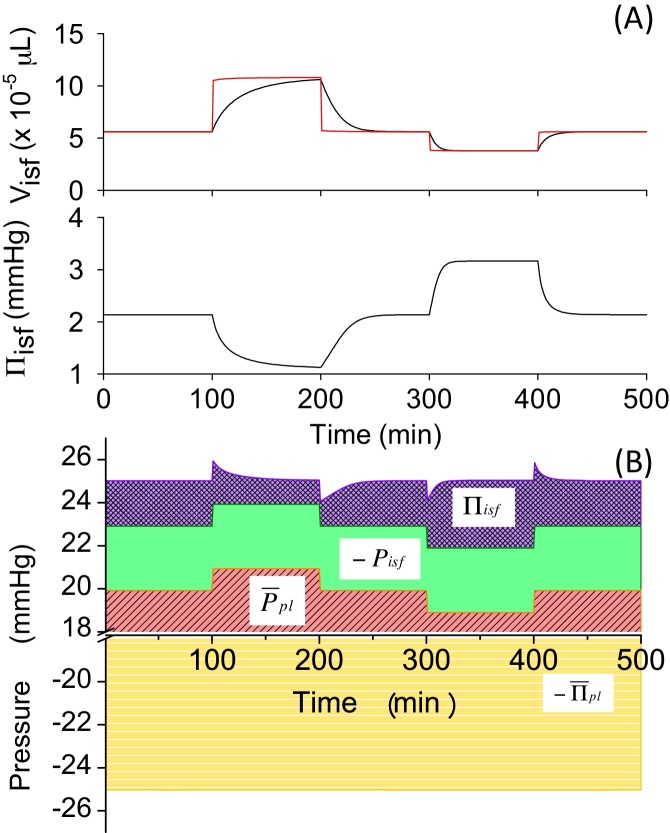
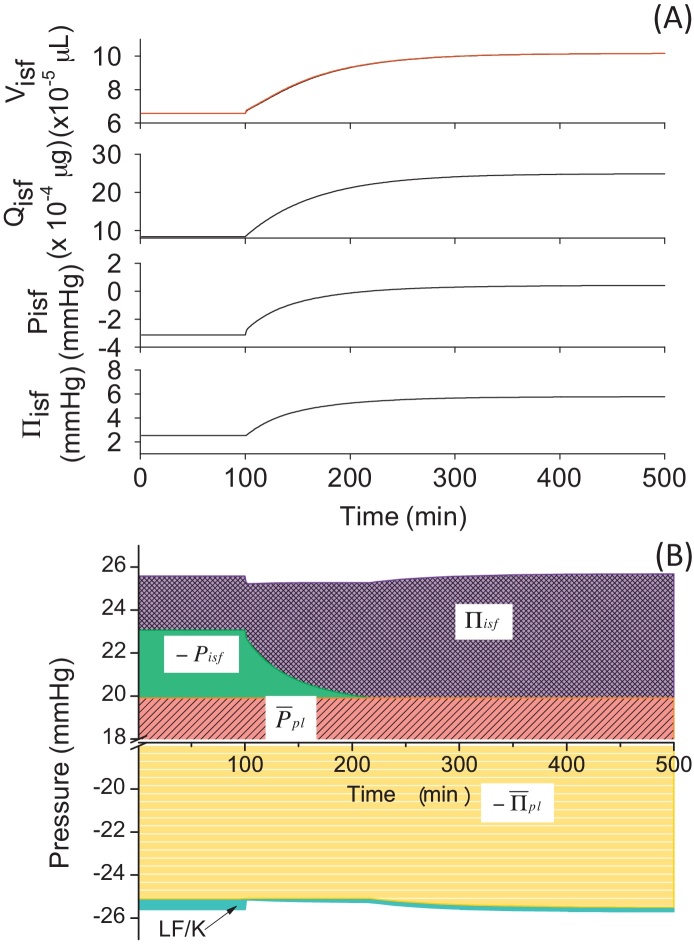
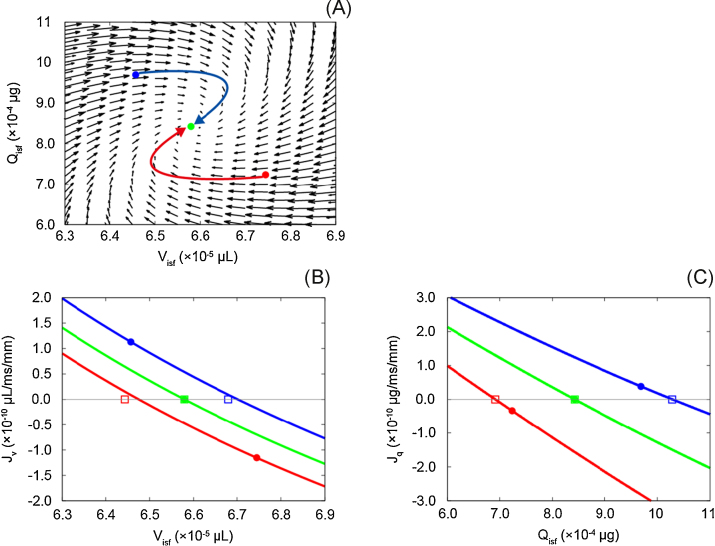
Results: An increase in blood pressure at the venous end of the capillary induced an interstitial-fluid volume increase, which, in turn, reduced negative tissue pressure to prevent edema. The lymphatic flow alleviated the edema by both carrying fluid away from the tissue and decreasing the colloidal osmotic pressure. From the model incorporating all three factors, we found that the interstitial-fluid volume changed quickly after the blood pressure change, and that the protein movement towards a certain equilibrium point followed the volume change.
Conclusion: Mathematical analyses revealed that the system of the capillary is stable near the equilibrium point at steady state and normal physiological capillary pressure. The time course of the tissue-volume change was determined by two kinetic mechanisms: rapid fluid exchange and slow protein fluxes.
Keywords: capillary; fluid exchange; interstitial fluid; volume regulation.
Figures
References
-
- Guyton A.C., Coleman T.G., Granger H.J. Circulation: overall regulation. Annu Rev Physiol. 1972;34:13–46. - PubMed
-
- Wiederhielm C.A. Dynamics of capillary fluid exchange: a nonlinear computer simulation. Microvasc Res. 1979;18:48–82. - PubMed
-
- Bert J.L., Pinder K.L. An analog computer simulation showing the effect of volume exclusion on capillary fluid exchange. Microvasc Res. 1982;24:94–103. - PubMed
-
- Curry F.E., Michel C.C. A fiber matrix model of capillary permeability. Microvasc Res. 1980;20:96–99. - PubMed
-
- Levick J.R. Capillary filtration-absorption balance reconsidered in light of dynamic extravascular factors. Exp Physiol. 1991;76:825–857. - PubMed
LinkOut - more resources
Full Text Sources
Other Literature Sources
