

Faster eating rates are associated with higher energy intakes during an ad libitum meal, higher BMI and greater adiposity among 4·5-year-old children: results from the Growing Up in Singapore Towards Healthy Outcomes (GUSTO) cohort
- PMID: 28462734
- PMCID: PMC5472197
- DOI: 10.1017/S0007114517000848
Faster eating rates are associated with higher energy intakes during an ad libitum meal, higher BMI and greater adiposity among 4·5-year-old children: results from the Growing Up in Singapore Towards Healthy Outcomes (GUSTO) cohort
Abstract
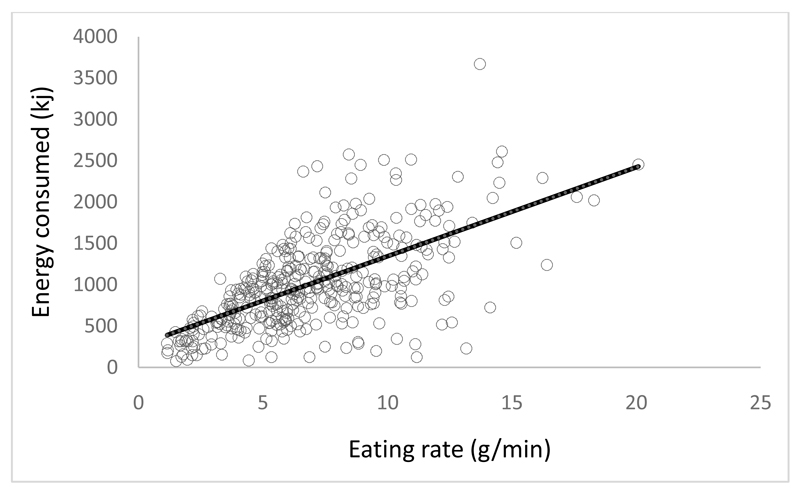
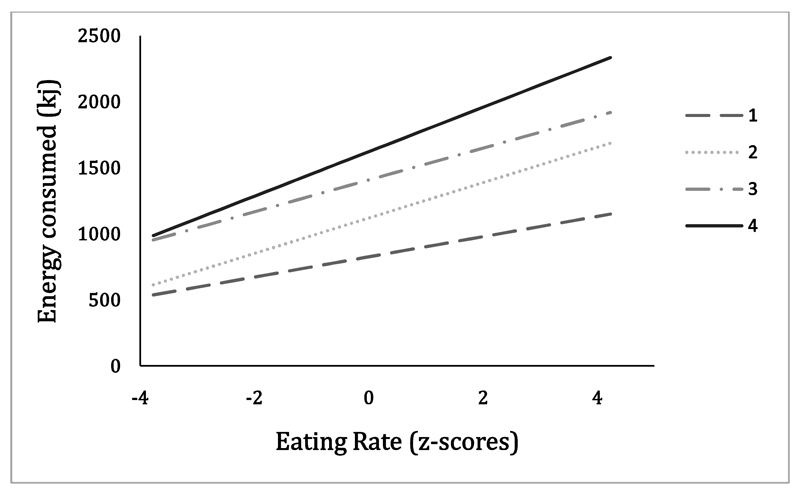
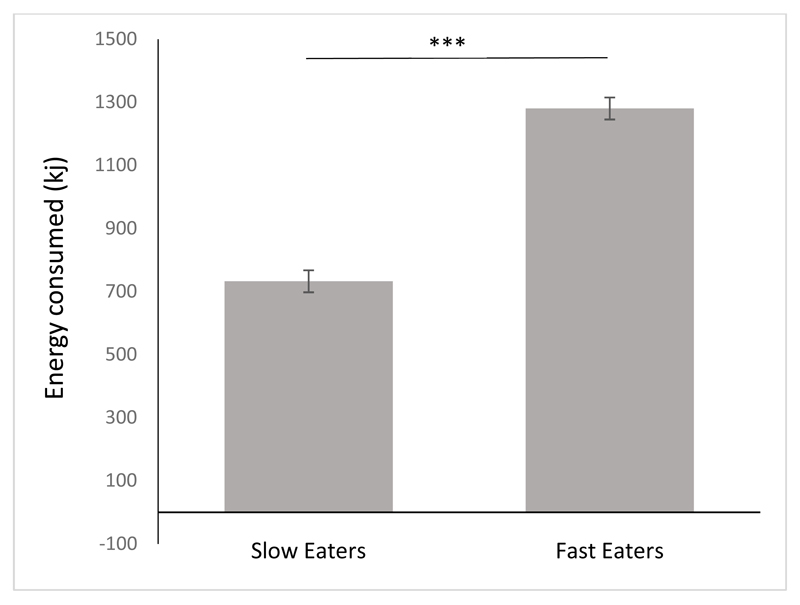
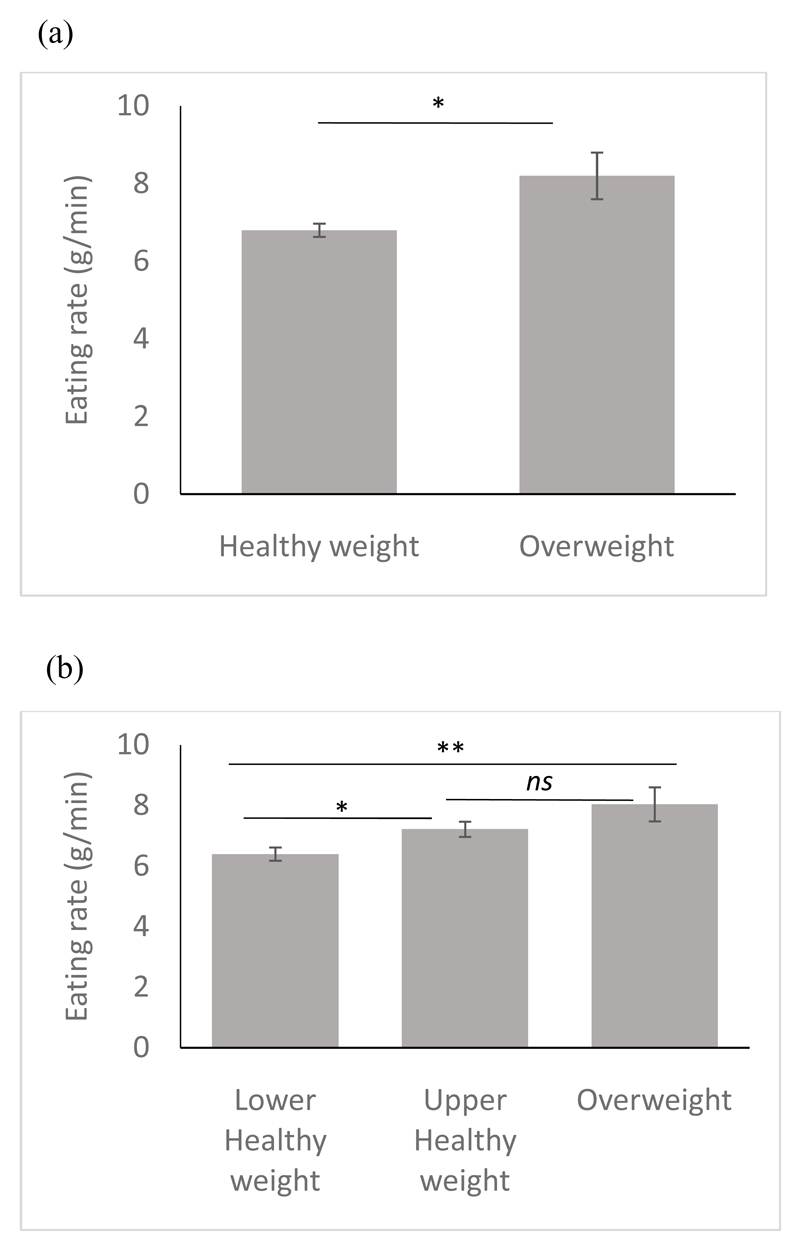
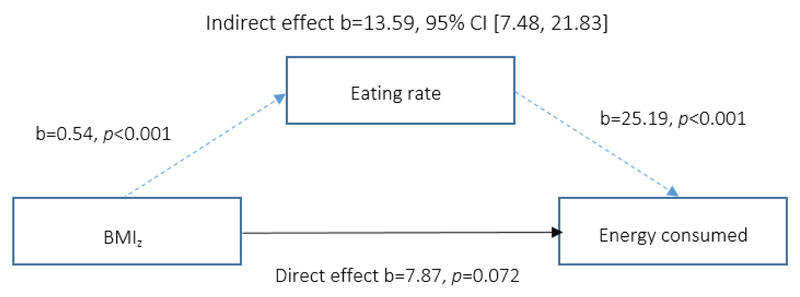
Faster eating rates are associated with increased energy intake, but little is known about the relationship between children's eating rate, food intake and adiposity. We examined whether children who eat faster consume more energy and whether this is associated with higher weight status and adiposity. We hypothesised that eating rate mediates the relationship between child weight and ad libitum energy intake. Children (n 386) from the Growing Up in Singapore Towards Healthy Outcomes cohort participated in a video-recorded ad libitum lunch at 4·5 years to measure acute energy intake. Videos were coded for three eating-behaviours (bites, chews and swallows) to derive a measure of eating rate (g/min). BMI and anthropometric indices of adiposity were measured. A subset of children underwent MRI scanning (n 153) to measure abdominal subcutaneous and visceral adiposity. Children above/below the median eating rate were categorised as slower and faster eaters, and compared across body composition measures. There was a strong positive relationship between eating rate and energy intake (r 0·61, P<0·001) and a positive linear relationship between eating rate and children's BMI status. Faster eaters consumed 75 % more energy content than slower eating children (Δ548 kJ (Δ131 kcal); 95 % CI 107·6, 154·4, P<0·001), and had higher whole-body (P<0·05) and subcutaneous abdominal adiposity (Δ118·3 cc; 95 % CI 24·0, 212·7, P=0·014). Mediation analysis showed that eating rate mediates the link between child weight and energy intake during a meal (b 13·59; 95 % CI 7·48, 21·83). Children who ate faster had higher energy intake, and this was associated with increased BMI z-score and adiposity.
Keywords: BMI z BMI z-score; SAT subcutaneous adipose tissue; VA visceral adipose tissue; Adiposity; Childhood obesity; Children; Eating rate; Energy intake; Mastication.
Conflict of interest statement
Figures

References
-
- World Health Organization. Report of the commission on ending childhood obesity. 2016
-
- Nishtar S, Gluckman P, Armstrong T. Ending childhood obesity: a time for action. The Lancet. 387(10021):825–7. - PubMed
-
- Silventoinen K, Rokholm B, Kaprio J, Sorensen TIA. The genetic and environmental influences on childhood obesity: a systematic review of twin and adoption studies. International Journal of Obesity. 2009;34(1):29–40. - PubMed
-
- Hebebrand J, Hinney A. Environmental and Genetic Risk Factors in Obesity. Child and Adolescent Psychiatric Clinics of North America. 2009;18(1):83–94. - PubMed
-
- Carnell S, Haworth CM, Plomin R, Wardle J. Genetic influence on appetite in children. International Journal of Obesity. 2008;32(10):1468–73. - PubMed
MeSH terms
Grants and funding
LinkOut - more resources
Full Text Sources
Other Literature Sources
Medical
Research Materials
