. 2017 May 2:6:e22054.
doi: 10.7554/eLife.22054.

Transcriptome analysis illuminates the nature of the intracellular interaction in a vertebrate-algal symbiosis

Affiliations

Transcriptome analysis illuminates the nature of the intracellular interaction in a vertebrate-algal symbiosis

John A Burns et al. Elife. .

Abstract

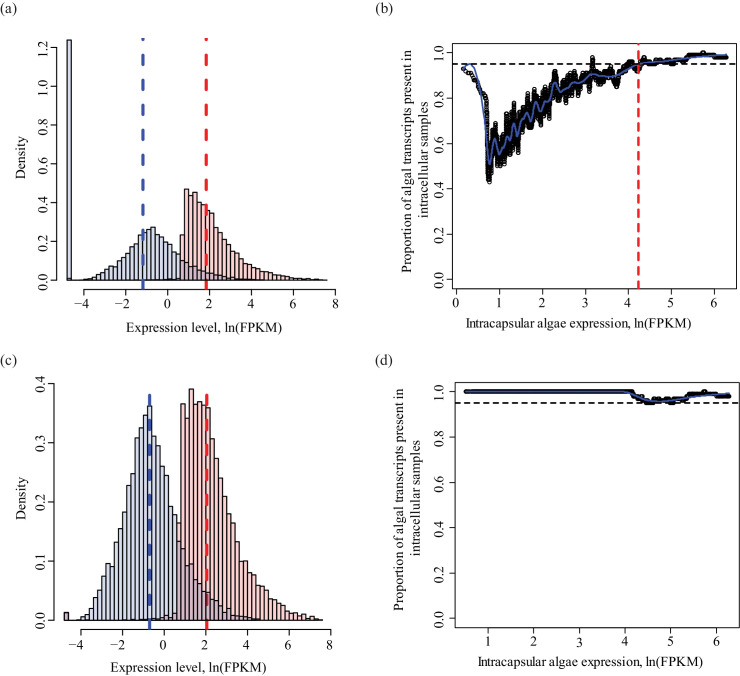
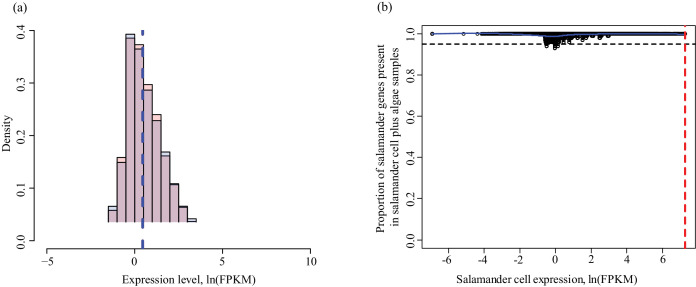
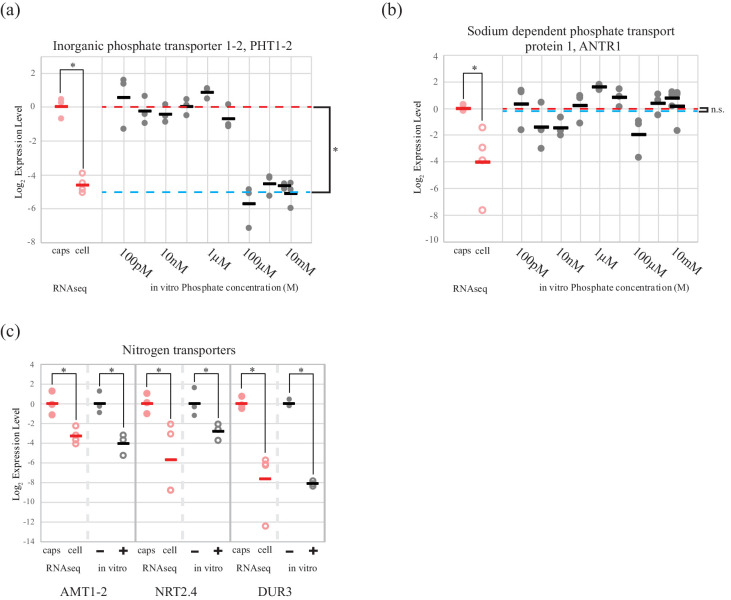
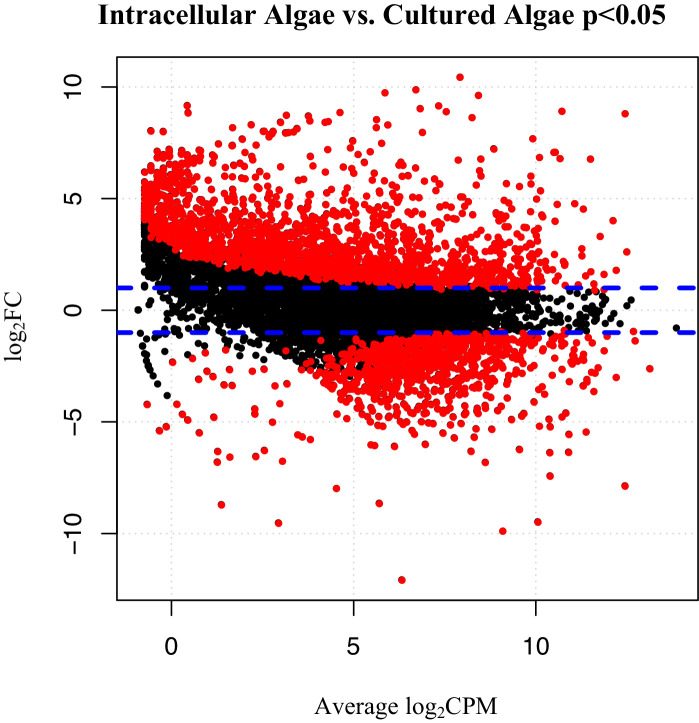
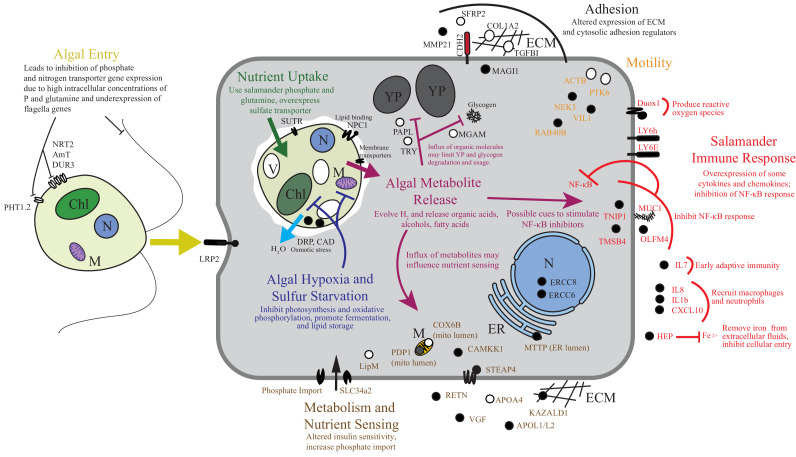
During embryonic development, cells of the green alga Oophila amblystomatis enter cells of the salamander Ambystoma maculatum forming an endosymbiosis. Here, using de novo dual-RNA seq, we compared the host salamander cells that harbored intracellular algae to those without algae and the algae inside the animal cells to those in the egg capsule. This two-by-two-way analysis revealed that intracellular algae exhibit hallmarks of cellular stress and undergo a striking metabolic shift from oxidative metabolism to fermentation. Culturing experiments with the alga showed that host glutamine may be utilized by the algal endosymbiont as a primary nitrogen source. Transcriptional changes in salamander cells suggest an innate immune response to the alga, with potential attenuation of NF-κB, and metabolic alterations indicative of modulation of insulin sensitivity. In stark contrast to its algal endosymbiont, the salamander cells did not exhibit major stress responses, suggesting that the host cell experience is neutral or beneficial.

Keywords: Ambystoma maculatum; Oophila amblystomatis; RNA-seq; ecology; evolutionary biology; genomics; symbiosis; transcriptomics.


Conflict of interest statement

The authors declare that no competing interests exist.

Figures

Figure 1.
Figure 1.. Three populations of cells from A. maculatum egg capsules containing stage 39 embryos were collected and prepared for mRNA extraction, cDNA sequencing, and differential expression analysis revealing several hundred significantly differentially expressed genes detected for the salamander and alga.
(a) Intracapsular algae (Population 1) were removed from intact eggs using a syringe and hypodermic needle (photo credit: Roger Hangarter). Embryos were decapsulated and washed, and the liver diverticulum region (dashed line), containing high concentrations of algae (red dots), was isolated and dissociated into a single cell suspension (illustration adapted from Harrison, 1969). The dissociated cells were screened for A. maculatum endoderm cells without alga (black arrowheads) and endoderm cells with intracellular alga (green arrowhead). Scale bars on microscope images are 20 µm. (b) Isolated endoderm cell, and isolated endoderm cell with intracellular alga. Scale bars on microscope images are 20 µm. (c) Representative cDNA distribution (bioanalyzer trace) from a population of 50 manually isolated A. maculatum endoderm cells. Peaks at 35 bp and 10380 bp are markers. Due to evidence of lysed A. maculatum cells observed in the cell suspension fluid after dissociation of A. maculatum embryos (debris seen in dissociated A. maculatum microscope images in (a) and (b)), that fluid was tested for the presence of contaminating mRNA. mRNA was not detected in the surrounding fluid, Figure 1—figure supplement 1. Lower limit abundance thresholds (Figure 1—figure supplement 2), and correction for low sequencing depth in intracelluar algal samples (Figure 1—figure supplement 3) were implemented to obtain the final gene sets used for differential expression analysis. Depth of sequencing was not biased for A. maculatum cell with and without alga samples (Figure 1—figure supplement 4). Library preparation GC bias affected the completeness of the algal transcriptome obtained from intracapsular and intracellular O. amblystomatis (Figure 1—figure supplement 5). (d and e) Dotplots of log2 fold change vs. expression level. The blue horizontal lines are plus and minus 4-fold change in expression between samples. The red dots are genes with FDR adjusted p-values<0.05, indicating a significant difference in expression level between conditions. (d) Differentially expressed algal transcripts. (e) Differentially expressed salamander transcripts. DOI: http://dx.doi.org/10.7554/eLife.22054.003
Figure 1—figure supplement 1.
Figure 1—figure supplement 1.. A. maculatum cell lysis during embryo dissociation did not contaminate the cell suspension fluid with significant quantities of mRNA.
(a) Representative cDNA distribution (bioanalyzer trace) from a population of 50 manually isolated A. maculatum endoderm cells. (b) No cDNA was produced when the fluid the cells were suspended in was tested indicating that the cDNA populations from manually isolated A. maculatum endoderm cells was specific and not contaminated with cDNAs derived from randomly lysed cells. In both (a) and (b), the peaks at 35 bp and 10380 bp are markers. DOI: http://dx.doi.org/10.7554/eLife.22054.007
Figure 1—figure supplement 2.
Figure 1—figure supplement 2.. Determining lower limit FPKM thresholds for inclusion in differential expression analysis.
For pairs of experimental conditions (i.e. n = 4 A. maculatum samples without intracellular algae, and n = 4 A. maculatum samples with intracellular algae), gene expression levels were sorted by the mean FPKM value (expression level) in one set of samples (i.e. in (a) expression levels of A. maculatum genes from samples with and without intracellular algae were sorted by mean expression per gene for n = 4 A. maculatum samples without intracellular algae). Using a sliding window of 100 genes, starting with the 100 most lowly expressed genes of the sorted set, median expression levels of the 100 gene bins were calculated for both experimental conditions. Those binned values were plotted with the expectation that on average, gene expression from one experimental condition should be positively correlated with gene expression from the other experimental condition. Vertical red dashed lines indicate the level of expression along the x-axis (in the sorted sample, determined by visual inspection of the plots) where positively correlated expression between the experimental conditions begins. Those values were used as lower limit thresholds in data pre-filtering steps. (a) Salamander cells with endosymbionts vs. salamander cells without endosymbionts; sorted by salamander cells without endosymbionts expression levels. (b) Salamander cells without endosymbionts vs. salamander cells with endosymbionts; sorted by salamander cells with endosymbionts expression levels. (c) Intracellular algae vs. intracapsular algae; sorted by intracapsular algae expression levels. (d) Intracapsular algae vs. intracellular algae; sorted by intracellular algae expression levels. DOI: http://dx.doi.org/10.7554/eLife.22054.008
Figure 1—figure supplement 3.
Figure 1—figure supplement 3.. Determining a threshold for absence calls in intracellular algal data.
Intracapsular algae samples had a higher sequencing depth than the intracellular algae. This filtering determined the lower FPKM limit of expression in intracapsular algae for inclusion in differential expression analysis. (a) Algal gene expression levels in intracapsular (red) and intracellular (blue) algae. The vertical dashed lines represent the median expression level of the respective populations. The large blue bar at −5 ln(FPKM) is the overrepresented proportion of genes with no expression in intracellular algal samples due to the low depth of sequencing. (b) Genes with low levels of intracapsular algal expression are detected in 100% of the intracellular algal samples due to pre-filtering inclusion of genes that were detected in all four intracellular algal samples. However, as the expression level of genes in intracapsular algal samples increases, the proportion of genes detected in intracellular algae decreases sharply with a minimum of 40%. Following this minimum, the proportion of genes detected in intracellular samples increase proportionally with the intracapsular expression. The red dashed vertical line is the FPKM value in intracapsular algae where 95% or more of the intracellular genes are detected. Below this threshold, a gene’s absence in intracellular genes is possibly due to the low sequencing depth, above this threshold, a gene’s absence in intracellular algae is interpreted as potential under-expression. (c) The same plot as in (a), after filtering to remove genes absent in intracellular algae with expression levels in intracapsular algae below threshold. (d) The same plot as in (b), after the dependence of detection on expression level was removed. DOI: http://dx.doi.org/10.7554/eLife.22054.009
Figure 1—figure supplement 4.
Figure 1—figure supplement 4.. Determining threshold for absence calls in salamander data.
The algal filtering described in Figure 1—figure supplement 3 was not required for salamander transcripts. (a) Salamander gene expression levels in salamander cells without algae (red) and salamander cells with algal endosymbionts (blue). Data is plotted on a natural log scale. The vertical dashed lines represent the median expression level of the respective populations (overlapping in this case). (b) The proportion of salamander mRNA’s detected in alga-containing cells does not depend on the mRNA expression level in salamander cells without algae. Greater than 95% of all genes are detected in salamander cells plus algal samples for all values of expression in salamander cells without alga samples. DOI: http://dx.doi.org/10.7554/eLife.22054.010
Figure 1—figure supplement 5.
Figure 1—figure supplement 5.. High GC content algal genes were not detected by the combination of SMARTer cDNA synthesis and Nextera-XT library preparation.
(a) The GC content distribution of algal transcripts generated using TrueSeq library preparation of total RNA, sequenced on the MySeq platform with approximately 30 million 75 bp paired end reads. 79% of eukaryote BUSCOs were detected in this assembly. The median GC content (green dashed line) is 62%. (b) The GC content distribution from (a), split by library preparation method. Red bars represent algal transcripts found in transcriptomes generated by both library preparation methods (SMARTer-Netxtera-XT and TruSeq). Blue bars represent transcripts found only in the transcriptome assembly from the TrueSeq library preparation method, that are absent from the transcriptome generated using the SMARTer cDNA synthesis-Nextera-XT library preparation method. There is an apparent bias against high GC content algal transcripts in library prepared using the SMARTer cDNA synthesis-Nextera-XT protocol (Kolgomorov-Smirnov test, p<2.2 × 10−16). Both libraries were sequenced to a similar depth of approximately 30 million reads for the alga-only samples in the total-evidence assembly from the SMARTer-cDNA synthesis-Nextera-XT library and 30 million reads for the TrueSeq library from unialgal cultures. Since sequencing depth was equivalent and GC bias is apparent, the data suggests that GC bias in the SMARTer-cDNA synthesis-Nextera-XT library is what accounts for the low number of detected BUSCOs (49%) in the algal transcriptome generated from wild-collected algal samples associated with salamander eggs and cells. (C.) The distribution of GC content in A. maculatum transcripts (gray bars) is centered around much lower GC content transcripts (median GC content of 43%) compared to that of O. amblystomatis (green bars, median GC content of 62%). The A. maculatum assembly contained 88% of eukaryote BUSCOs. Our evidence points to bias against high GC content transcripts in the SMARTer cDNA synthesis and Nextera-XT library prep method, that becomes significant above 60% GC content. Transcripts with GC content of 60% or greater are in the tail of the salamander GC content distribution, but near the median of the algal GC content distribution. This offers an explanation for the BUSCO results, where the salamander transcriptome from the wild-collected samples is comprehensive, while the algal transcriptome from the same samples and library prep methods is missing around 40% of the algal transcriptome. DOI: http://dx.doi.org/10.7554/eLife.22054.011
Figure 2.
Figure 2.. An algal phosphate transporter is modulated by inorganic phosphate levels, while nitrogen source transporters are modulated by an organic nitrogen source, glutamine.
Normalized measurements from RNAseq data are provided for direct visual comparison of effect sizes in intracellular algae compared to in vitro experiments. Intracapsular alga measurements are ‘caps’ (filled red circles); intracellular alga measurements are ‘cell’ (empty red circles). (a) Expression of high affinity phosphate transporter PhT1-2 mRNA across a range of phosphate concentrations. (b) Expression of chloroplast sodium dependent phosphate transporter ANTR1 mRNA across a range of phosphate concentrations. In (a) and (b) The red dashed line indicates the average expression of the phosphate transporter in the low phosphate range (100 pM to 1 µM); the blue dashed line indicates the average expression in the high phosphate range (10 µM to 10 mM). (c) Expression of three algal nitrogen transporters in the absence (-) and presence (+) of 2 mM L-glutamine. Data is plotted on a log2 scale on the y axis, where more negative values indicate lower expression levels. Circles are individual replicates; bars are the average for each experiment. *p<0.05; n.s. indicates no significant difference; the statistical test performed was an ANOVA with contrasts. DOI: http://dx.doi.org/10.7554/eLife.22054.016
Figure 3.
Figure 3.. Differentially expressed genes between intracellular algae and cultured algae.
Red dots indicate significantly differentially expressed genes (FDR < 0.05). Blue dashed lines represent a plus and minus 2-fold difference in expression. There are 1,805 over-expressed genes in intracellular algae and 802 under-expressed genes in intracellular algae in this comparison. DOI: http://dx.doi.org/10.7554/eLife.22054.019
Figure 3—figure supplement 1.
Figure 3—figure supplement 1.. REViGO anlysis of GO terms associated with 1805 over-expressed genes in intracellular algae compared to cultured algae.
This analysis shows enrichment in fermentation processes such as glycerol-3 phosphate metabolism, 2-oxoglutarate metabolism, the glyoxylate cycle, photosystem II stability, photosystem I, and sulfur assimilation, all of which are consistent with the hypothesis that the intracellular algae are fermenting. Processes such as protein folding, apoptotic cell clearance, and sodium ion homeostasis support the hypothesis that the intracellular algae are stressed. DOI: http://dx.doi.org/10.7554/eLife.22054.021
Figure 3—figure supplement 2.
Figure 3—figure supplement 2.. REViGO anlysis of 882 under-expressed genes in intracellular algae compared to cultured algae.
Under-expressed processes involved in oxidative pathways, photoprotection, and protein refolding are further evidence of an intracellular algal stress response. DOI: http://dx.doi.org/10.7554/eLife.22054.022
Figure 4.
Figure 4.. Differential expression of fermentation genes in intracellular algae compared to cultured algae.
Blue dots are genes that were over-expressed in intracellular algae compared to intracapsular algae. Orange dots are genes that were under-expressed in intracellular algae compared to intracapsular algae. Vertical blue lines represent plus and minus two-fold fold change. The horizontal blue line represents FDR adjusted p-value equal to 0.05. Genes above the horizontal blue line are significantly differentially expressed; genes below the blue line are not. Key fermentation genes, PFOR, HYDA1, ADHE, and PAT are significantly over-expressed in intracellular algae compared to cultured algae, in the same manner as they are over-expressed in intracellular algae compared to intracapsular algae. Several components of complex I of the electron transport chain in the mitochondrion are also significantly under-expressed (CYB, ND2, ND4), though ND1 is over-expressed in intracellular algae compared to cultured algae. DOI: http://dx.doi.org/10.7554/eLife.22054.023
Figure 5.
Figure 5.. A. maculatum BCL2L14 protein has both a BH3 and BH2 domain.
A multiple alignment of the A. maculatum BCL2L14 protein sequence with other organisms reveals a conserved BH3 and BH2 domains (boxed). DOI: http://dx.doi.org/10.7554/eLife.22054.024
Figure 6.
Figure 6.. Summary of the major changes in both salamander and algal cells and how they may relate to one another.
The inferred salamander responses are broken into four functional categories while algal changes fall within three primary functional categories based on gene annotations. Text indicates hypothetical changes within each category based on the implied roles of under-expressed or over-expressed genes. Major sections are color-coded. Over-expressed genes represented by solid black symbols. Under-expressed gene symbols are white with black outlines. Cellular compartments are in italics. M=mitochondrion, YP=yolk platelet, V=vacuole, N=nucleus, ECM=extracellular matrix, ER=endoplasmic reticulum, Chl=chloroplast. DOI: http://dx.doi.org/10.7554/eLife.22054.025
Figure 7.
Figure 7.. GC and transcript length bias in SMARTer-cDNA synthesis-Nextera-XT libraries compared to TrueSeq libraries.
Red lines indicate the GC content or transcript length biases in reads obtained from SMARTer-cDNA synthesis-Nextera-XT libraries. Blue lines indicate the GC content or transcript length biases in reads obtained from TrueSeq libraries. (a) GC content and length are plotted against ‘QRfit’ which is a measure of fit by quantile regression to the models in Hansen et al. (2012). This metric approximates bias in the sequence dataset by comparing read counts to expected models based on quantiles in the distribution of the GC content of the transcripts. The opposing trends in the two sets of lines shows that GC content bias between the two different libraries is vastly different. The reads obtained from SMARTer-cDNA synthesis-Nextera-XT libraries will tend to have more counts for low GC content transcripts, while the reads obtained from TrueSeq libraries will tend to have more counts for high GC content transcripts, systemically. (b) There is also some moderate transcript length bias differences between the two library prep methods visualized as the separation between the groups of red and blue lines. The methods implemented by the conditional quantile normalization (cqn) package in R handles both types of bias to make the gene count data from both library preparation methods comparable. DOI: http://dx.doi.org/10.7554/eLife.22054.026

Comment in

  • Gasping for air.
    Ball SG, Cenci U. Ball SG, et al. Elife. 2017 May 2;6:e27004. doi: 10.7554/eLife.27004. Elife. 2017. PMID: 28462778 Free PMC article.

References

    1. Ali S, Mann DA. Signal transduction via the NF‐κB pathway: a targeted treatment modality for infection, inflammation and repair. Cell Biochemistry and Function. 2004;22:67–79. doi: 10.1002/cbf.1082. - DOI - PubMed
    1. Ashour DS. Toll-like receptor signaling in parasitic infections. Expert Review of Clinical Immunology. 2015;11:771–780. doi: 10.1586/1744666X.2015.1037286. - DOI - PubMed
    1. Bachmann MD, Carlton RG, Burkholder JM, Wetzel RG. Symbiosis between salamander eggs and green algae: microelectrode measurements inside eggs demonstrate effect of photosynthesis on oxygen concentration. Canadian Journal of Zoology. 1986;64:1586–1588. doi: 10.1139/z86-239. - DOI
    1. Baddar NW, Woodcock MR, Khatri S, Kump DK, Voss SR. Sal-Site: research resources for the mexican axolotl. Methods in Molecular Biology. 2015;1290:321–336. doi: 10.1007/978-1-4939-2495-0_25. - DOI - PubMed
    1. Barbieri FD, Raisman JS, Albarracin C. Amylase and glycogenolysis in amphibian development. The Biological Bulletin. 1967;132:299–310. doi: 10.2307/1539635. - DOI - PubMed

Publication types

LinkOut - more resources