. 2017 Jun 1;127(6):2339-2352.
doi: 10.1172/JCI92217. Epub 2017 May 2.

CD1b-autoreactive T cells contribute to hyperlipidemia-induced skin inflammation in mice

Affiliations

CD1b-autoreactive T cells contribute to hyperlipidemia-induced skin inflammation in mice

Sreya Bagchi et al. J Clin Invest. .

Abstract

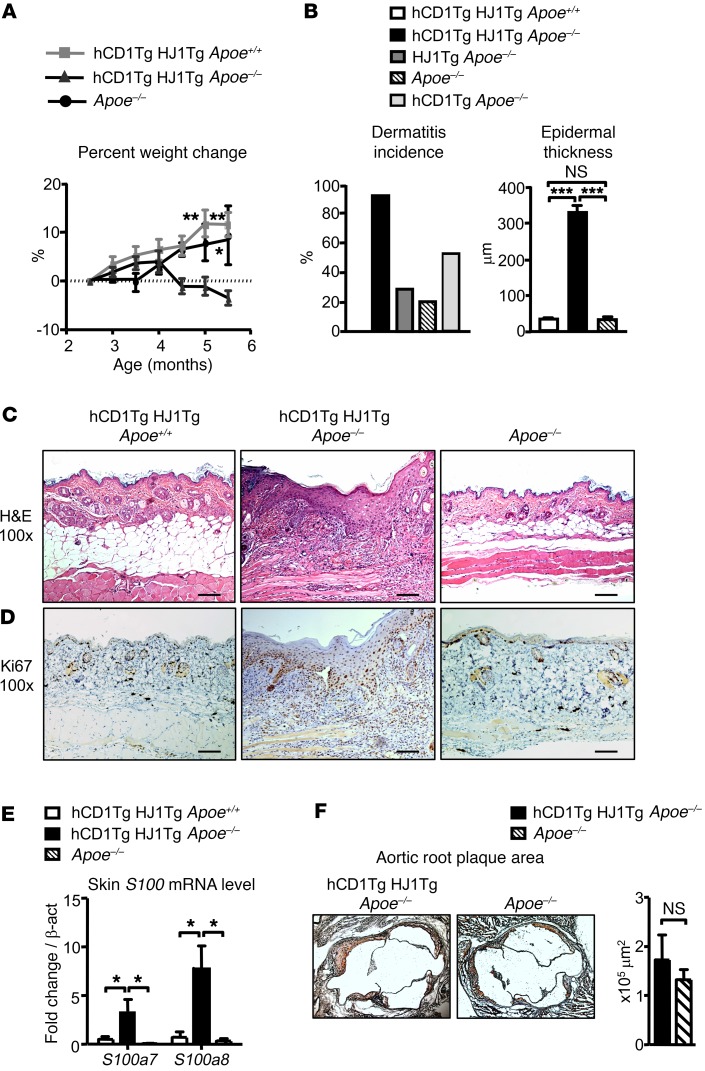
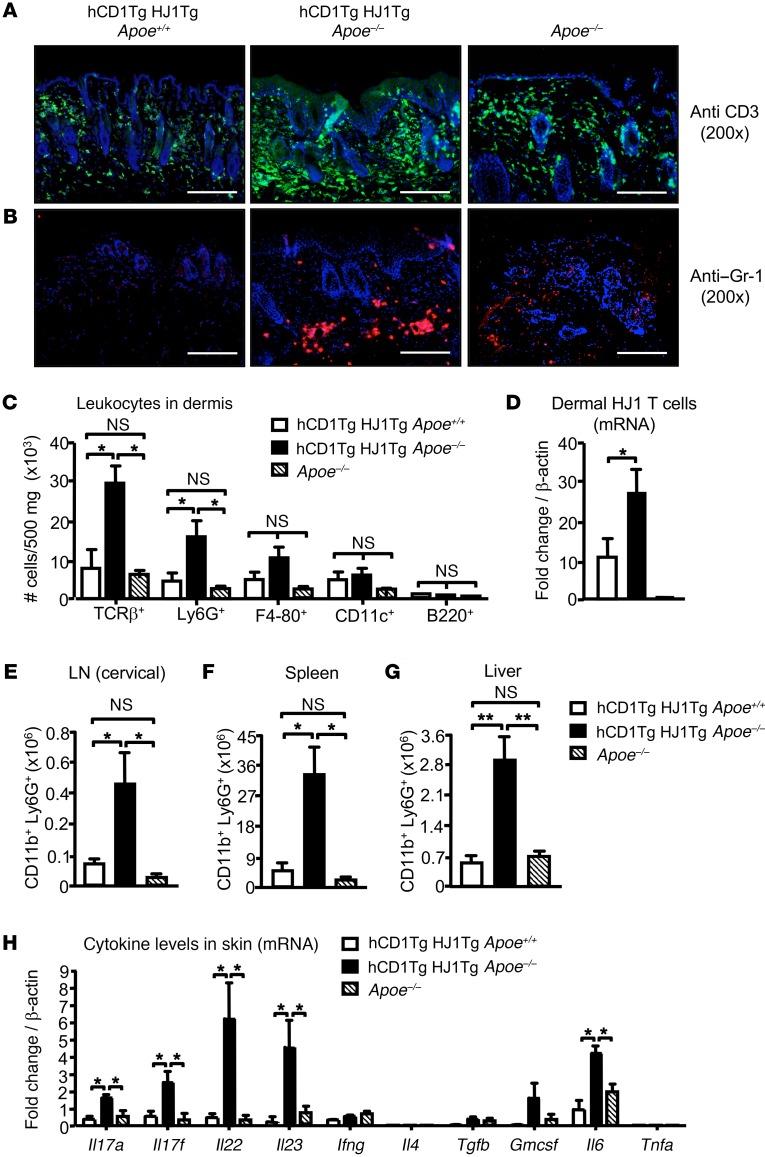
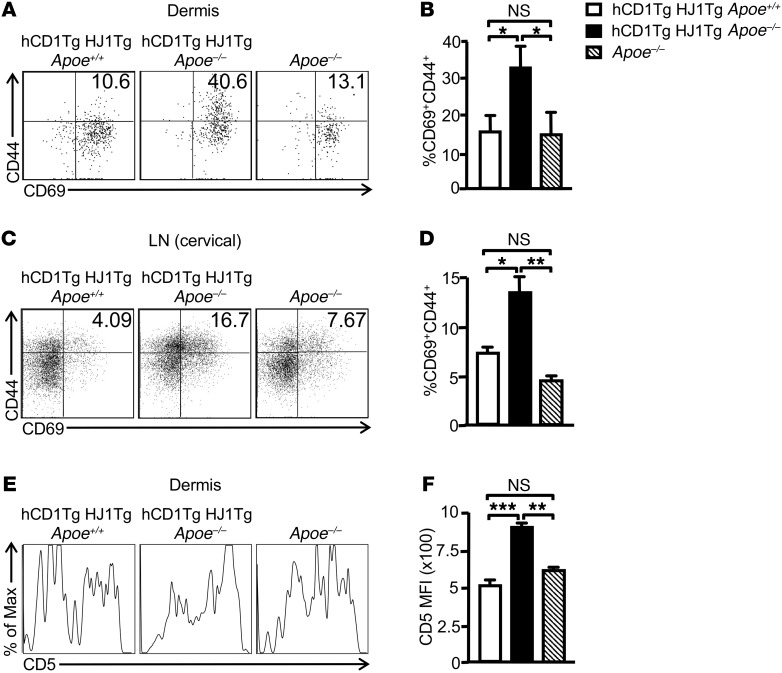
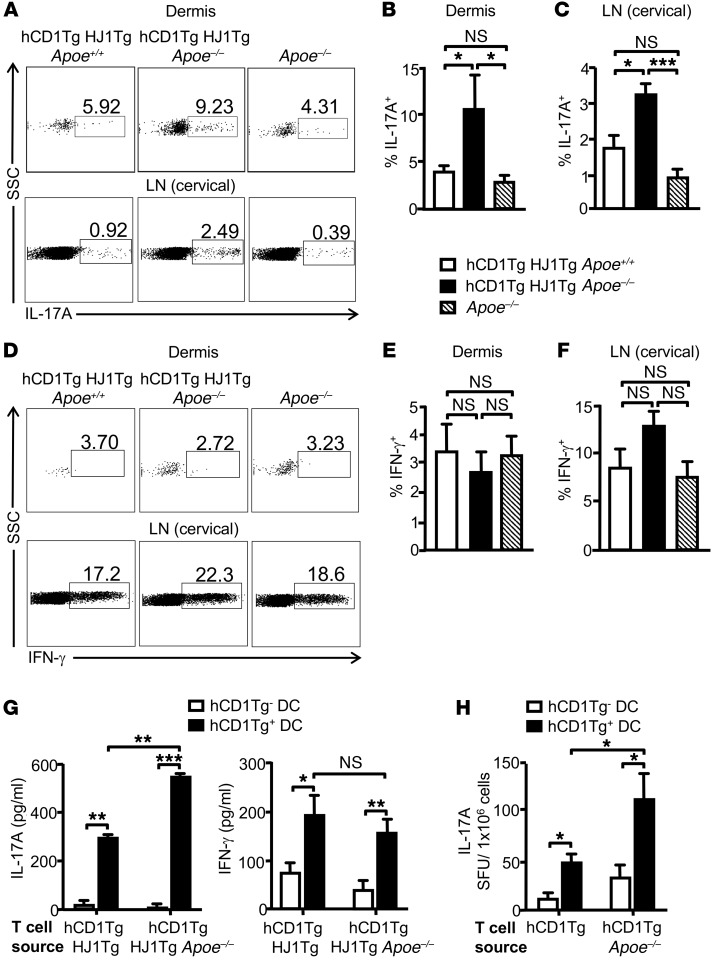
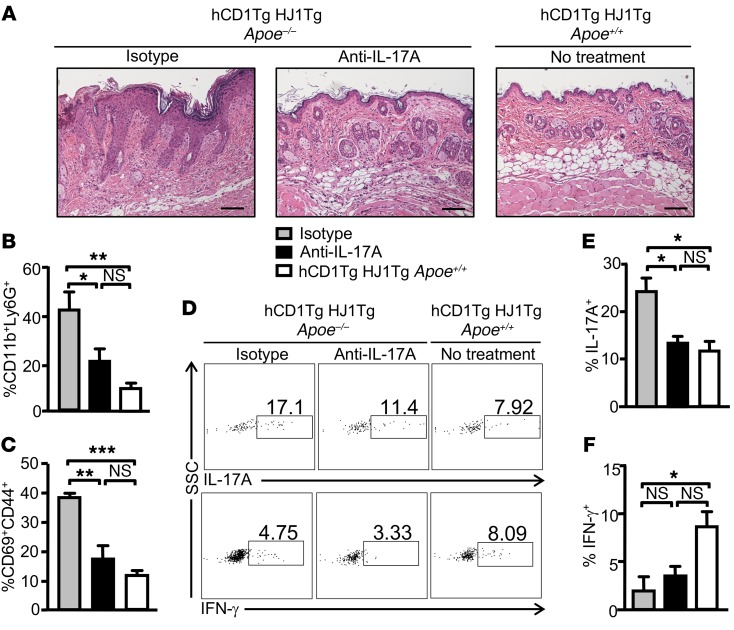
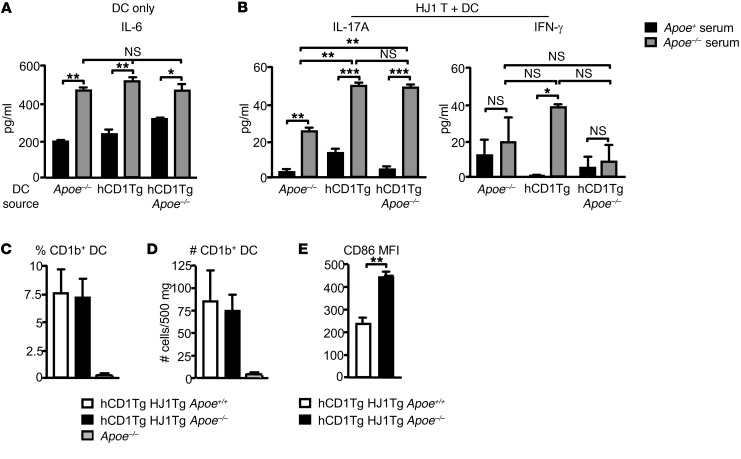
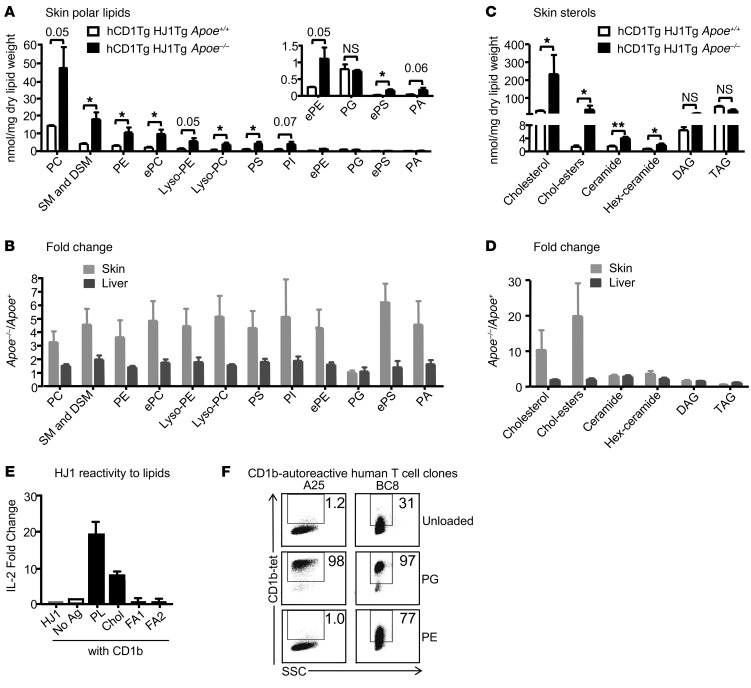
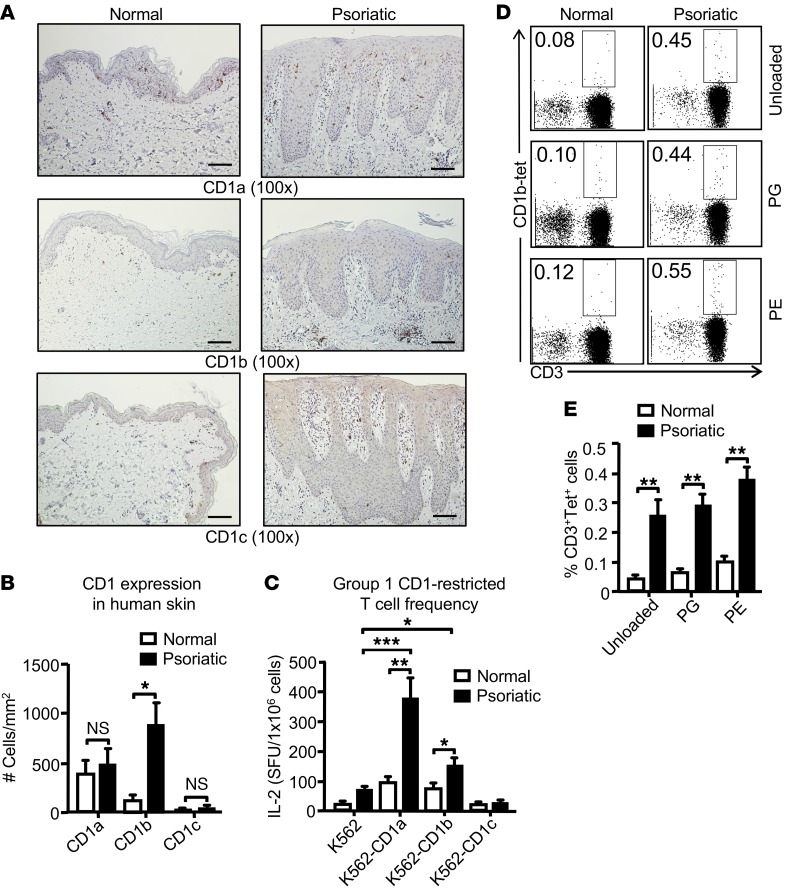
A large proportion of human T cells are autoreactive to group 1 CD1 proteins, which include CD1a, CD1b, and CD1c. However, the physiological role of the CD1 proteins remains poorly defined. Here, we have generated a double-transgenic mouse model that expresses human CD1b and CD1c molecules (hCD1Tg) as well as a CD1b-autoreactive TCR (HJ1Tg) in the ApoE-deficient background (hCD1Tg HJ1Tg Apoe-/- mice) to determine the role of CD1-autoreactive T cells in hyperlipidemia-associated inflammatory diseases. We found that hCD1Tg HJ1Tg Apoe-/- mice spontaneously developed psoriasiform skin inflammation characterized by T cell and neutrophil infiltration and a Th17-biased cytokine response. Anti-IL-17A treatment ameliorated skin inflammation in vivo. Additionally, phospholipids and cholesterol preferentially accumulated in diseased skin and these autoantigens directly activated CD1b-autoreactive HJ1 T cells. Furthermore, hyperlipidemic serum enhanced IL-6 secretion by CD1b+ DCs and increased IL-17A production by HJ1 T cells. In psoriatic patients, the frequency of CD1b-autoreactive T cells was increased compared with that in healthy controls. Thus, this study has demonstrated the pathogenic role of CD1b-autoreactive T cells under hyperlipidemic conditions in a mouse model of spontaneous skin inflammation. As a large proportion of psoriatic patients are dyslipidemic, this finding is of clinical significance and indicates that self-lipid-reactive T cells might serve as a possible link between hyperlipidemia and psoriasis.


Conflict of interest statement

Conflict of interest: The authors have declared that no conflict of interest exists.

Figures

Figure 1
Figure 1. hCD1Tg HJ1Tg Apoe–/– mice spontaneously develop skin inflammation.
(A) Mice were weighed beginning at 2.5 months of age up to 5.5 months of age. Percentage change in body weight was calculated over the time period (n = 4–10). (B) Mice were monitored from 20 to 25 weeks for the development of dermatitis and percentages of incidence recorded (left); epidermal thickness was also quantified (right; n = 11–14). (C and D) Representative H&E (C) and Ki67 (D) staining of skin sections from 6-month-old mice. Scale bars: 100 μm. (E) mRNA analysis of S100a proteins in the skin of indicated mice (n = 3–5). (F) Representative oil red O–stained sections from aortic root of Apoe–/– and hCD1Tg HJ1Tg Apoe–/– mice (left panel) are shown, and bar graph depicts the mean + SEM of aortic root plaque area from indicated mice (n = 8–9). ***P < 0.005; **P < 0.01; *P < 0.05. Statistical analyses were performed using 1-way ANOVA followed by Bonferroni’s post-hoc test for 3-group comparisons and Student’s t test for 2-group comparisons.
Figure 2
Figure 2. Diseased skin in hCD1Tg HJ1Tg Apoe–/– mice is characterized by T cell and neutrophil infiltrates.
Indicated organs were harvested from mice at about 25 weeks of age when hCD1Tg HJ1Tg Apoe–/– mice exhibited fulminant disease. (A and B) Immunofluorescence staining of skin sections from indicated mice with anti-CD3 (A) and anti–Gr-1 (B). Scale bars: 100 μm. (C) Bar graph depicts the absolute number of various leukocyte subsets in the dermis of mice, performed using flow cytometry (n = 3–5). (D) mRNA analysis of HJ1 T cells in the skin of the mice using HJ1 TCR–specific primers. (EG) hCD1Tg HJ1Tg Apoe–/– mice have systemic neutrophil infiltration. Quantification of neutrophils (CD11b+Ly6G+cells) in the cervical LNs (E), spleen (F), and liver (G) was performed using flow cytometry (n = 4–6). (H) mRNA detected in the skin of different mouse strains using cytokine-specific primers (n = 3–5). mRNA levels were normalized relative to β-actin. Values are mean + SEM. ***P < 0.005; **P < 0.01. Statistical analyses were performed using 1-way ANOVA followed by Bonferroni’s post-hoc test.
Figure 3
Figure 3. Increased activation of T cells is observed in the skin and cervical LNs of hCD1Tg HJ1Tg Apoe–/– mice.
Dermal and LN cells were isolated from indicated mice at 25 weeks of age, stained with anti-CD45 Abs, and gated on TCRβ+ cells. Cell-surface staining was performed for T cell activation markers. (A and C) Representative FACS plots of the expression of T cell activation markers CD69 and CD44 in the dermis (A) and cervical LNs (C). (B and D) Bar graphs depict the mean + SEM of the percentages of CD69+CD44+ T cells in the dermis (B) and LNs (D) of the mice (n = 5–10). (E) Representative FACS plots of CD5 expression on dermal T cells from indicated mice. (F) Bar graph depicts the MFI of CD5 expression on dermal T cells in different mouse strains (n = 3). ***P < 0.005; **P < 0.01; *P< 0.05. Statistical analyses were performed using 1-way ANOVA followed by Bonferroni’s post-hoc test.
Figure 4
Figure 4. T cells in hCD1Tg HJ1Tg Apoe–/– mice produce elevated levels of IL-17A.
Dermal and LN cells from indicated mice were stimulated with PMA/ionomycin to measure intracellular cytokine secretion. Cells were gated on CD45+ and TCRβ+ populations. (A) Representative FACS plots of IL-17A–producing T cells in the dermis (upper panels) and cervical LNs (lower panels) in indicated mice. (B and C) Bar graphs (mean + SEM) depict the percentages of IL-17A–producing T cells in the dermis (B) and cervical LNs (C). (D) Representative FACS plots of IFN-γ–producing T cells in the dermis and cervical LNs. (E and F) Quantification of IFN-γ–producing T cells in the dermis (E) and cervical LNs (F) (n = 4–5). (G) WT (hCD1Tg) and hCD1Tg+ BMDCs were cocultured with enriched T cells from either hCD1Tg HJ1Tg Apoe+/+ or hCD1Tg HJ1Tg Apoe–/– mice for 48 hours. Amount of IL-17A (left panel) and IFN-γ (right panel) was determined by ELISA. Data are representative of 3 independent experiments. (H) T cells were enriched from hCD1Tg and hCD1Tg Apoe–/– mice and cocultured with WT or hCD1Tg+ DCs for 24 hours. IL-17A–producing cells were quantified by ELISPOT assays. Data are representative of 2 independent experiments. ***P < 0.005; **P < 0.01; *P < 0.05. Statistical analyses were performed using 1-way ANOVA followed by Bonferroni’s post-hoc test for 3-group comparisons and Student’s t test for 2-group comparisons.
Figure 5
Figure 5. In vivo anti–IL-17A treatment ameliorates skin inflammation in hCD1Tg HJ1Tg Apoe–/– mice.
(A) Representative H&E staining of skin sections from untreated hCD1Tg/HJ1Tg mice and hCD1Tg HJ1Tg Apoe–/– mice treated with either anti–IL-17A mAbs or isotype control Abs. Scale bars: 100 μm. Cells from the dermis of mice were isolated, stained with indicated Abs, and analyzed by flow cytometry. (B) Bar graph depicts the percentages of neutrophils (CD11b+Ly6G+) within the CD45+ gated population from different groups of mice. (C) Bar graph depicts the percentages of CD69+CD44+ cells within the TCRβ+CD45+ gated population from different groups of mice. (D–F) Intracellular cytokine production was measured in dermal T cells after PMA/ionoycin stimulation. (D) Representative FACS plots of IL-17A–producing (upper panels) and IFN-γ–producing (lower panels) T cells in the skin of indicated mice. (E and F) Bar graphs (mean + SEM) depict the percentages of IL-17A– (E) and IFN-γ–producing (F) T cells in the skin of 3 different groups of mice (n = 3 per group). ***P < 0.005; **P < 0.01; *P < 0.05. Statistical analyses were performed using 1-way ANOVA followed by Bonferroni’s post-hoc test.
Figure 6
Figure 6. DC function and phenotype under hyperlipidemic conditions.
(A) Pam3Cys-treated hCD1Tg, hCD1Tg Apoe–/–, and Apoe–/– LN–derived DCs were cultured in Apoe+/+ and Apoe–/– mouse serum. IL-6 was measured by cytometric bead array (CBA) after 48 hours. (B) hCD1Tg, hCD1Tg Apoe–/–, and Apoe–/– DCs were cocultured with hepatic HJ1 T cells from hCD1Tg HJ1Tg Rag–/– mice in Apoe+/+ and Apoe–/– serum for 48 hours. ELISA was used to measure IFN-γ and IL-17A secretion. Data are representative of at least 2 independent experiments. (CE) Cells from the dermis were isolated, stained with various Abs, and gated on CD45 and CD11b+CD11c+ DCs. Percentages (C) and numbers (D) of CD1b-positive cells in the skin were quantified. (E) CD1b+DCs (gated on CD11b+CD11c+ population) were examined for their expression of costimulatory molecule CD86 (n = 4). ***P < 0.005; **P < 0.01; *P < 0.05. Statistical analyses were performed using 1-way ANOVA followed by Bonferroni’s post-hoc test for 3 group comparisons and Student’s t test for 2 group comparisons.
Figure 7
Figure 7. Phospholipid and cholesterol species, which preferentially accumulate in the skin of hCD1Tg HJ1Tg Apoe–/– mice, can activate HJ1 T cells.
Total lipid was extracted from skin and liver tissues of mice, weighed, and analyzed by mass spectrometry and gas chromatography. (A) Comparison of phospholipid accumulation in the skin of diseased hCD1Tg HJ1Tg Apoe–/– and healthy hCD1Tg HJ1Tg Apoe+/+ mice. (B) Ratio of phospholipids from diseased over healthy mice in the skin and liver. PC, phosphatidylcholine; SM, sphingomyelin; DSM, dihydro-sphingomyelin; ePC, ether-linked phosphatidylcholine; PS, phosphatidylserine; PI, phosphatidylinositol; ePE, ether-linked phosphatidylethanolamine; ePS, ether-linked phosphatidylserine; PA, phosphatidic acid. (C) Comparison of apolar lipid accumulation in the skin of diseased hCD1Tg HJ1Tg Apoe–/– and healthy hCD1Tg HJ1Tg Apoe+/+ mice. (D) Ratio of apolar lipids from diseased over healthy mice in the skin and liver (n = 3). (E) Polar lipid extract (PL), cholesterol (Chol), and fatty acid mixtures (FA1 and FA2) were loaded onto CD1b protein and incubated with HJ1 T cell hybridoma for 24 hours. IL-2 in the supernatant was measured by ELISA. (F) CD1b-autoreactive human T cell clones were stained with mock-loaded CD1b tetramers or PG- or PE-loaded CD1b tetramers. Data are representative of at least 3 experiments. ***P < 0.005; **P < 0.01; *P < 0.05, Student’s t test.
Figure 8
Figure 8. Psoriatic patients have an increased frequency of autoreactive group 1 CD1–restricted T cells.
Psoriatic and normal skin biopsies were stained with Abs against CD1a, CD1b, and CD1c. Scale bars: 100 μm. (B) Bar graph depicts number of CD1a-, CD1b-, and CD1c-positive cells/mm2 (mean + SEM) (n = 3); skin biopsies were derived from psoriatic patients who were hyperlipidemic. (C) K562 alone and K562 CD1 transfectants were cocultured with human T cells (n = 9) that were stimulated twice with autologous mo-DCs followed by IL-2 ELISPOT assay. (D) PBMCs from psoriatic and normal individuals were stained with untreated CD1b tetramers or CD1b tetramers loaded with PE and PG (n = 5 for psoriatic patients; n = 8 for normal individuals). Cells depicted on the FACS plots were first gated on the lymphocyte population and then on CD19 cells. (E) Bar graph depicts mean ± SEM of the percentages of tetramer-positive cells. ***P < 0.005; **P < 0.01; *P < 0.05, Mann-Whitney U test.

References

    1. Ogden CL, Carroll MD, Fryar CD, Flegal KM. Prevalence of obesity among adults youth: United States, 2011-2014. NCHS Data Brief. 2015;(219):1–8. - PubMed
    1. Nelson RH. Hyperlipidemia as a risk factor for cardiovascular disease. Prim Care. 2013;40(1):195–211. doi: 10.1016/j.pop.2012.11.003. - DOI - PMC - PubMed
    1. Azfar RS, Gelfand JM. Psoriasis and metabolic disease: epidemiology and pathophysiology. Curr Opin Rheumatol. 2008;20(4):416–422. doi: 10.1097/BOR.0b013e3283031c99. - DOI - PMC - PubMed
    1. Pietrzak A, Michalak-Stoma A, Chodorowska G, Szepietowski JC. Lipid disturbances in psoriasis: an update. Mediators Inflamm. 2010:2010. - PMC - PubMed
    1. Carrascosa JM, et al. Obesity and psoriasis: inflammatory nature of obesity, relationship between psoriasis and obesity, and therapeutic implications. Actas Dermosifiliogr. 2014;105(1):31–44. doi: 10.1016/j.ad.2012.08.003. - DOI - PubMed