

Simulating the spread of selection-driven genotypes using landscape resistance models for desert bighorn sheep
- PMID: 28464013
- PMCID: PMC5413035
- DOI: 10.1371/journal.pone.0176960
Simulating the spread of selection-driven genotypes using landscape resistance models for desert bighorn sheep
Abstract
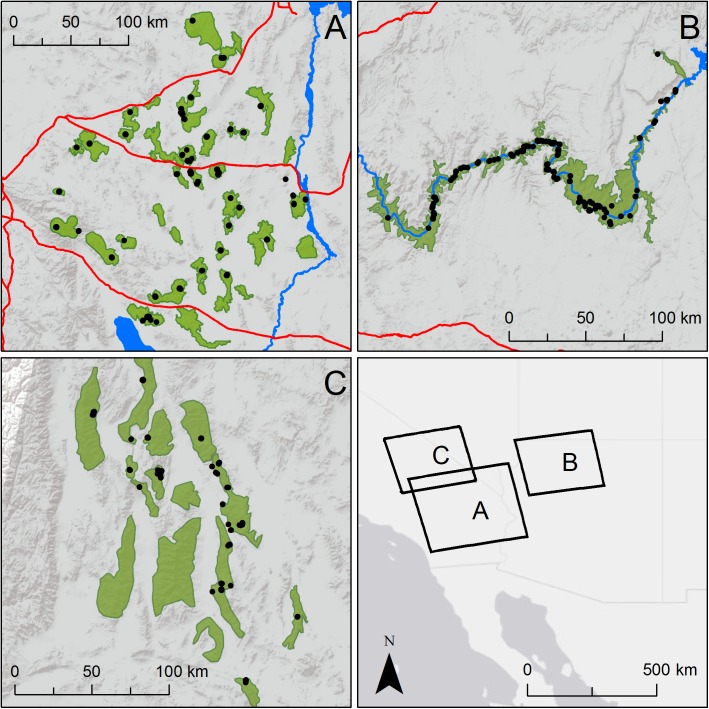
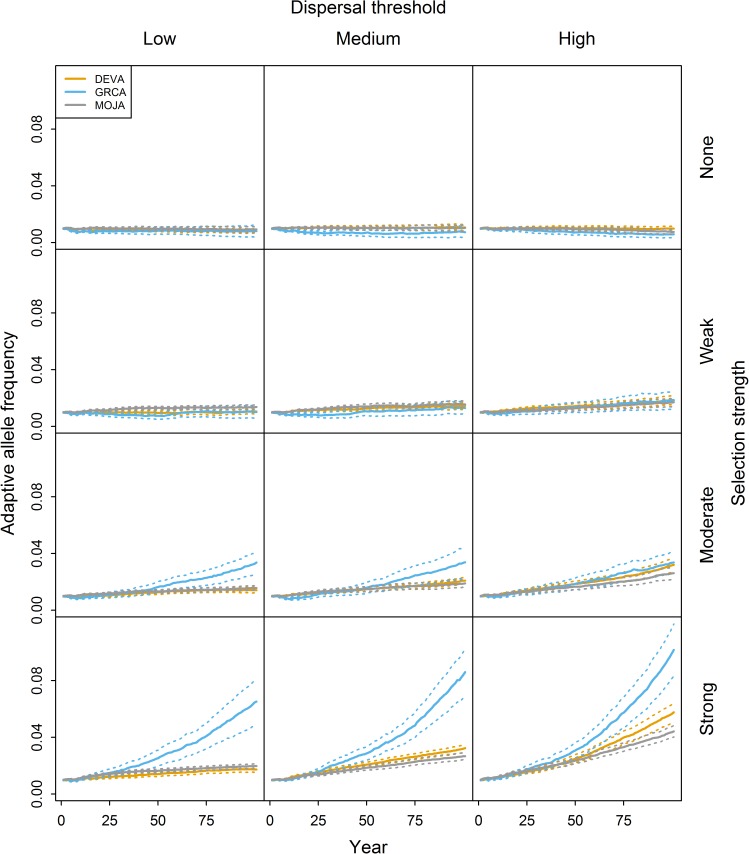
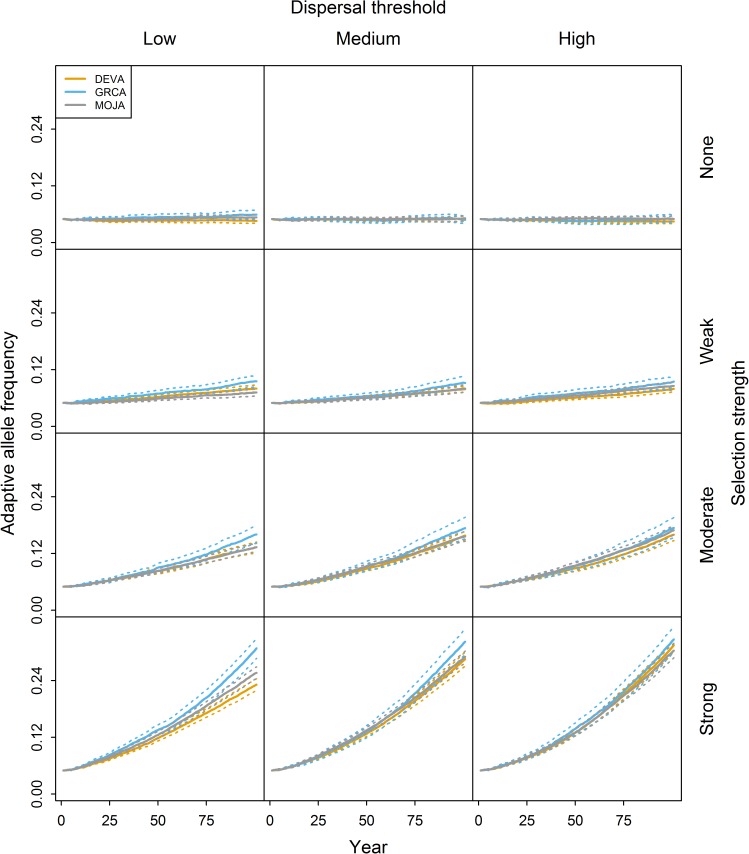
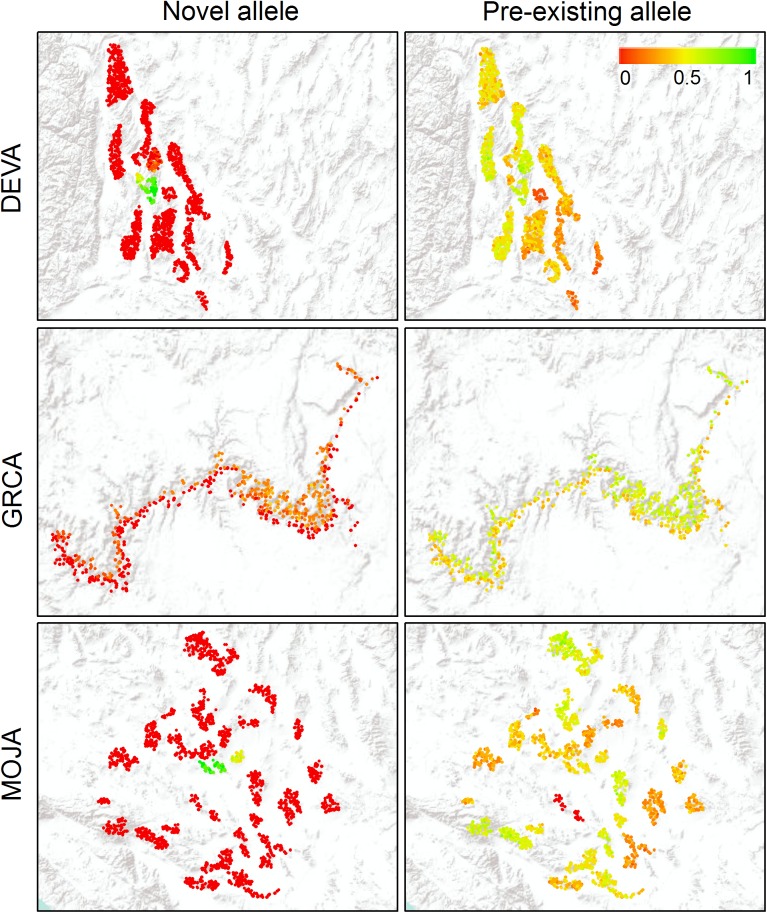
Landscape genetic studies based on neutral genetic markers have contributed to our understanding of the influence of landscape composition and configuration on gene flow and genetic variation. However, the potential for species to adapt to changing landscapes will depend on how natural selection influences adaptive genetic variation. We demonstrate how landscape resistance models can be combined with genetic simulations incorporating natural selection to explore how the spread of adaptive variation is affected by landscape characteristics, using desert bighorn sheep (Ovis canadensis nelsoni) in three differing regions of the southwestern United States as an example. We conducted genetic sampling and least-cost path modeling to optimize landscape resistance models independently for each region, and then simulated the spread of an adaptive allele favored by selection across each region. Optimized landscape resistance models differed between regions with respect to landscape variables included and their relationships to resistance, but the slope of terrain and the presence of water barriers and major roads had the greatest impacts on gene flow. Genetic simulations showed that differences among landscapes strongly influenced spread of adaptive genetic variation, with faster spread (1) in landscapes with more continuously distributed habitat and (2) when a pre-existing allele (i.e., standing genetic variation) rather than a novel allele (i.e., mutation) served as the source of adaptive genetic variation. The combination of landscape resistance models and genetic simulations has broad conservation applications and can facilitate comparisons of adaptive potential within and between landscapes.
Conflict of interest statement
Figures
Similar articles
-
Genetic analysis of differentiation among breeding ponds reveals a candidate gene for local adaptation in Rana arvalis.Mol Ecol. 2011 Apr;20(8):1582-600. doi: 10.1111/j.1365-294X.2011.05025.x. Epub 2011 Feb 17. Mol Ecol. 2011. PMID: 21332585
-
Year-round water management for desert bighorn sheep corresponds with visits by predators not bighorn sheep.PLoS One. 2020 Nov 24;15(11):e0241131. doi: 10.1371/journal.pone.0241131. eCollection 2020. PLoS One. 2020. PMID: 33232333 Free PMC article.
-
Assessing changes in functional connectivity in a desert bighorn sheep metapopulation after two generations.Mol Ecol. 2018 May;27(10):2334-2346. doi: 10.1111/mec.14586. Epub 2018 May 3. Mol Ecol. 2018. PMID: 29637641
-
Landscape genetics in a changing world: disentangling historical and contemporary influences and inferring change.Mol Ecol. 2015 Dec;24(24):6021-40. doi: 10.1111/mec.13454. Epub 2015 Dec 7. Mol Ecol. 2015. PMID: 26547281 Review.
-
Contemporary evolution during invasion: evidence for differentiation, natural selection, and local adaptation.Mol Ecol. 2015 May;24(9):1999-2017. doi: 10.1111/mec.13162. Epub 2015 Apr 20. Mol Ecol. 2015. PMID: 25891044 Review.
Cited by
-
Both candidate gene and neutral genetic diversity correlate with parasite resistance in female Mediterranean mouflon.BMC Ecol. 2019 Mar 5;19(1):12. doi: 10.1186/s12898-019-0228-x. BMC Ecol. 2019. PMID: 30836982 Free PMC article.
-
Genetic structure of Mycoplasma ovipneumoniae informs pathogen spillover dynamics between domestic and wild Caprinae in the western United States.Sci Rep. 2019 Oct 25;9(1):15318. doi: 10.1038/s41598-019-51444-x. Sci Rep. 2019. PMID: 31653889 Free PMC article.
-
The active spread of adaptive variation for reef resilience.Ecol Evol. 2019 Sep 2;9(19):11122-11135. doi: 10.1002/ece3.5616. eCollection 2019 Oct. Ecol Evol. 2019. PMID: 31641460 Free PMC article.
-
Circuit-theory applications to connectivity science and conservation.Conserv Biol. 2019 Apr;33(2):239-249. doi: 10.1111/cobi.13230. Epub 2018 Nov 27. Conserv Biol. 2019. PMID: 30311266 Free PMC article. Review.
References
-
- Sork VL, Waits L. Contributions of landscape genetics–approaches, insights, and future potential. Molecular Ecology. 2010;19(17):3489–95. doi: 10.1111/j.1365-294X.2010.04786.x - DOI - PubMed
-
- Zeller K, McGarigal K, Whiteley A. Estimating landscape resistance to movement: a review. Landscape Ecology. 2012;27(6):777–97.
-
- Holderegger R, Kamm U, Gugerli F. Adaptive vs. neutral genetic diversity: implications for landscape genetics. Landscape Ecology. 2006;21(6):797–807.
-
- Holderegger R, Wagner HH. Landscape genetics. BioScience. 2008;58(3):199–207.
-
- Manel S, Holderegger R. Ten years of landscape genetics. Trends in Ecology & Evolution. 2013;28(10):614–21. - PubMed
MeSH terms
LinkOut - more resources
Full Text Sources
Other Literature Sources
