

Multi-criteria manufacturability indices for ranking high-concentration monoclonal antibody formulations
- PMID: 28464235
- PMCID: PMC5575515
- DOI: 10.1002/bit.26329
Multi-criteria manufacturability indices for ranking high-concentration monoclonal antibody formulations
Abstract
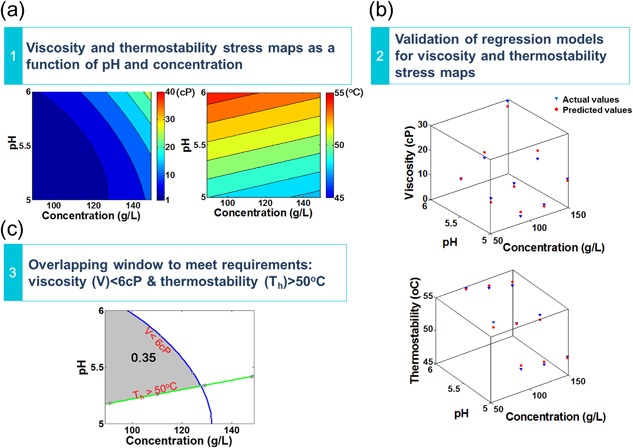
The need for high-concentration formulations for subcutaneous delivery of therapeutic monoclonal antibodies (mAbs) can present manufacturability challenges for the final ultrafiltration/diafiltration (UF/DF) step. Viscosity levels and the propensity to aggregate are key considerations for high-concentration formulations. This work presents novel frameworks for deriving a set of manufacturability indices related to viscosity and thermostability to rank high-concentration mAb formulation conditions in terms of their ease of manufacture. This is illustrated by analyzing published high-throughput biophysical screening data that explores the influence of different formulation conditions (pH, ions, and excipients) on the solution viscosity and product thermostability. A decision tree classification method, CART (Classification and Regression Tree) is used to identify the critical formulation conditions that influence the viscosity and thermostability. In this work, three different multi-criteria data analysis frameworks were investigated to derive manufacturability indices from analysis of the stress maps and the process conditions experienced in the final UF/DF step. Polynomial regression techniques were used to transform the experimental data into a set of stress maps that show viscosity and thermostability as functions of the formulation conditions. A mathematical filtrate flux model was used to capture the time profiles of protein concentration and flux decay behavior during UF/DF. Multi-criteria decision-making analysis was used to identify the optimal formulation conditions that minimize the potential for both viscosity and aggregation issues during UF/DF. Biotechnol. Bioeng. 2017;114: 2043-2056. © 2017 The Authors. Biotechnology and Bioengineering Published by Wiley Perodicals, Inc.
Keywords: aggregation; data mining; developability assessment; high-concentration mAb formulation; manufacturability index; viscosity.
© 2017 The Authors. Biotechnology and Bioengineering Published by Wiley Perodicals, Inc.
Figures


Similar articles
-
Ultrafiltration behavior of monoclonal antibodies and Fc-fusion proteins: Effects of physical properties.Biotechnol Bioeng. 2017 Sep;114(9):2057-2065. doi: 10.1002/bit.26326. Epub 2017 May 18. Biotechnol Bioeng. 2017. PMID: 28464237
-
Strategies for high-concentration drug substance manufacturing to facilitate subcutaneous administration: A review.Biotechnol Bioeng. 2020 Nov;117(11):3591-3606. doi: 10.1002/bit.27510. Epub 2020 Aug 3. Biotechnol Bioeng. 2020. PMID: 32687221 Review.
-
A mechanistic model to account for the Donnan and volume exclusion effects in ultrafiltration/diafiltration process of protein formulations.Biotechnol Prog. 2021 Mar;37(2):e3106. doi: 10.1002/btpr.3106. Epub 2020 Dec 14. Biotechnol Prog. 2021. PMID: 33289341
-
A Small-Scale Process for Predicting Donnan and Volume Exclusion Effects During Ultrafiltration/Diafiltration Process Development.J Pharm Sci. 2018 May;107(5):1296-1303. doi: 10.1016/j.xphs.2018.01.010. Epub 2018 Jan 12. J Pharm Sci. 2018. PMID: 29339134
-
Formulation and manufacturability of biologics.Curr Opin Biotechnol. 2009 Dec;20(6):708-14. doi: 10.1016/j.copbio.2009.10.006. Epub 2009 Oct 31. Curr Opin Biotechnol. 2009. PMID: 19880308 Review.
Cited by
-
Effects of Monovalent Salt on Protein-Protein Interactions of Dilute and Concentrated Monoclonal Antibody Formulations.Antibodies (Basel). 2022 Mar 31;11(2):24. doi: 10.3390/antib11020024. Antibodies (Basel). 2022. PMID: 35466277 Free PMC article.
-
Predictive modeling of concentration-dependent viscosity behavior of monoclonal antibody solutions using artificial neural networks.MAbs. 2023 Jan-Dec;15(1):2169440. doi: 10.1080/19420862.2023.2169440. MAbs. 2023. PMID: 36705325 Free PMC article.
-
Evaluation of Crystal Zenith Microtiter Plates for High-Throughput Formulation Screening.J Pharm Sci. 2020 Jan;109(1):532-542. doi: 10.1016/j.xphs.2019.10.027. Epub 2019 Oct 25. J Pharm Sci. 2020. PMID: 31669607 Free PMC article.
-
Understanding the Role of Preferential Exclusion of Sugars and Polyols from Native State IgG1 Monoclonal Antibodies and its Effect on Aggregation and Reversible Self-Association.Pharm Res. 2019 May 24;36(8):109. doi: 10.1007/s11095-019-2642-3. Pharm Res. 2019. PMID: 31127417
-
Developability assessment at early-stage discovery to enable development of antibody-derived therapeutics.Antib Ther. 2022 Nov 11;6(1):13-29. doi: 10.1093/abt/tbac029. eCollection 2023 Jan. Antib Ther. 2022. PMID: 36683767 Free PMC article. Review.
References
-
- Arakawa T, Timasheff SN. 1985. Theory of protein solubility. Methods Enzymol 114:49–77. - PubMed
-
- Breiman L, Friedman J, Olshen R, Stone C. 1984. Classification and regression trees. New York, NY, USA: Chapman & Hall.
-
- Goldberg DS, Bishop SM, Shah AU, Sathish HA. 2011. Formulation development of therapeutic monoclonal antibodies using high‐throughput fluorescence and static light scattering techniques: Role of conformational and colloidal stability. J Pharm Sci 100(4):1306–1315. - PubMed
-
- Grajski KA, Breiman L, Diprisco GV, Freeman WJ. 1986. Classification of EEG spatial patterns with a tree‐structured methodology − CART. IEEE Trans Biomed Eng 33(12):1076–1086. - PubMed
-
- Harris RJ, Shire SJ, Winter C. 2004. Commercial manufacturing scale formulation and analytical characterization of therapeutic recombinant antibodies. Drug Dev Res 61(3):137–154.
Publication types
MeSH terms
Substances
LinkOut - more resources
Full Text Sources
Other Literature Sources
Miscellaneous
