

doi: 10.1002/jbio.201600317.
Epub 2017 May 2.
Sensitivity of spatially offset Raman spectroscopy (SORS) to subcortical bone tissue
Affiliations
- PMID: 28464501
- PMCID: PMC5971662
- DOI: 10.1002/jbio.201600317
Item in Clipboard
Sensitivity of spatially offset Raman spectroscopy (SORS) to subcortical bone tissue
J Biophotonics.
2017 Aug.
Abstract
The development of spatially offset Raman spectroscopy (SORS) has enabled deep, non-invasive chemical characterization of turbid media. Here, we use SORS to measure subcortical bone tissue and depth-resolved biochemical variability in intact, exposed murine bones. We also apply the technique to study a mouse model of the genetic bone disorder osteogenesis imperfecta. The results suggest that SORS is more sensitive to disease-related biochemical differences in subcortical trabecular bone and marrow than conventional Raman measurements.
Keywords: bone; osteogenesis imperfecta; spatially offset Raman spectroscopy.
© 2017 Wiley-VCH Verlag GmbH & Co. KGaA, Weinheim.
Figures
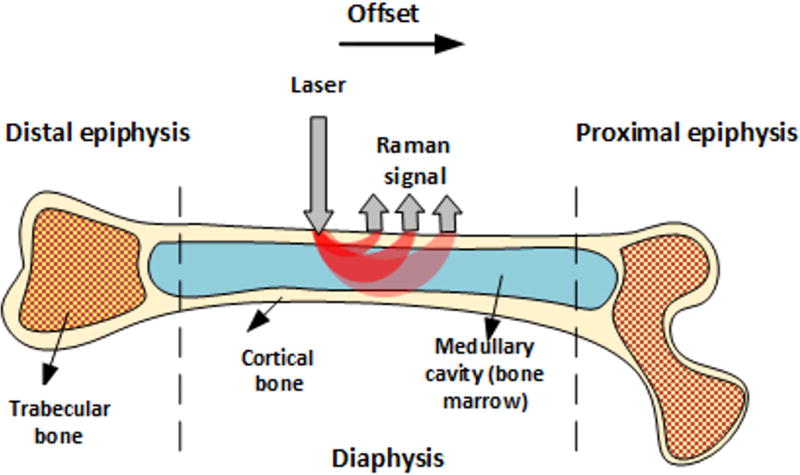
Macroscopic bone components and SORS measurement geometry.
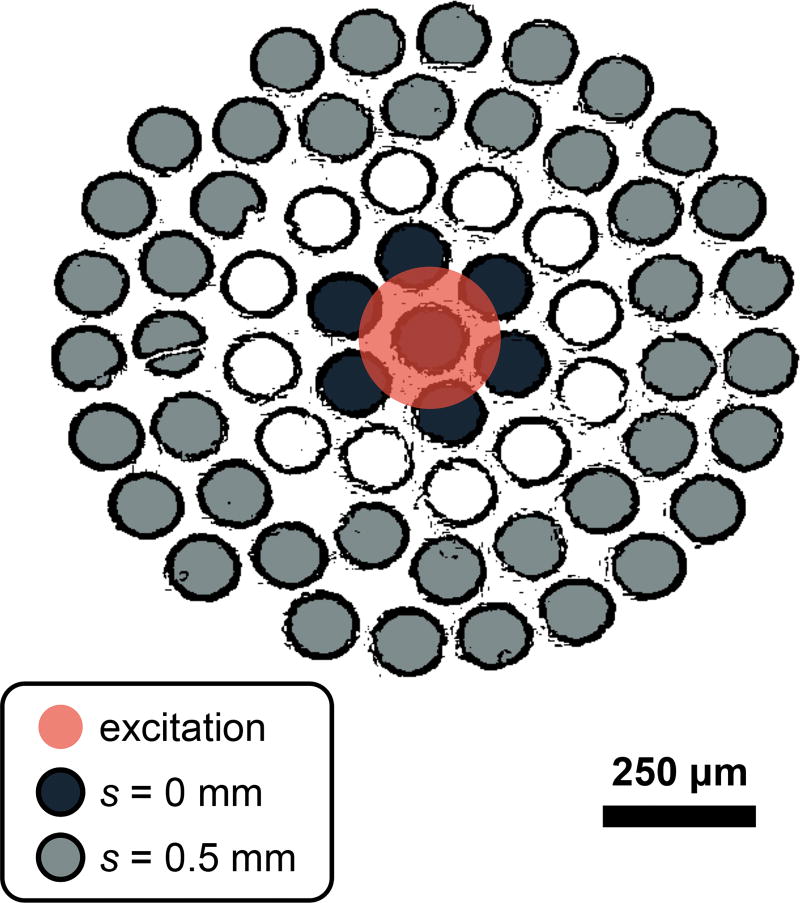
Fiber bundle diagram depicting the relationship between the excitation spot and the collection regions (s = 0 and s = 0.5 mm) on the surface of the sample. The diagram was generated by applying an edge detection filter to a white-light image of the fiber bundle face. Note that only signal from 40 of the total 61 optical fibers were detected due to the limited height of the CCD camera.
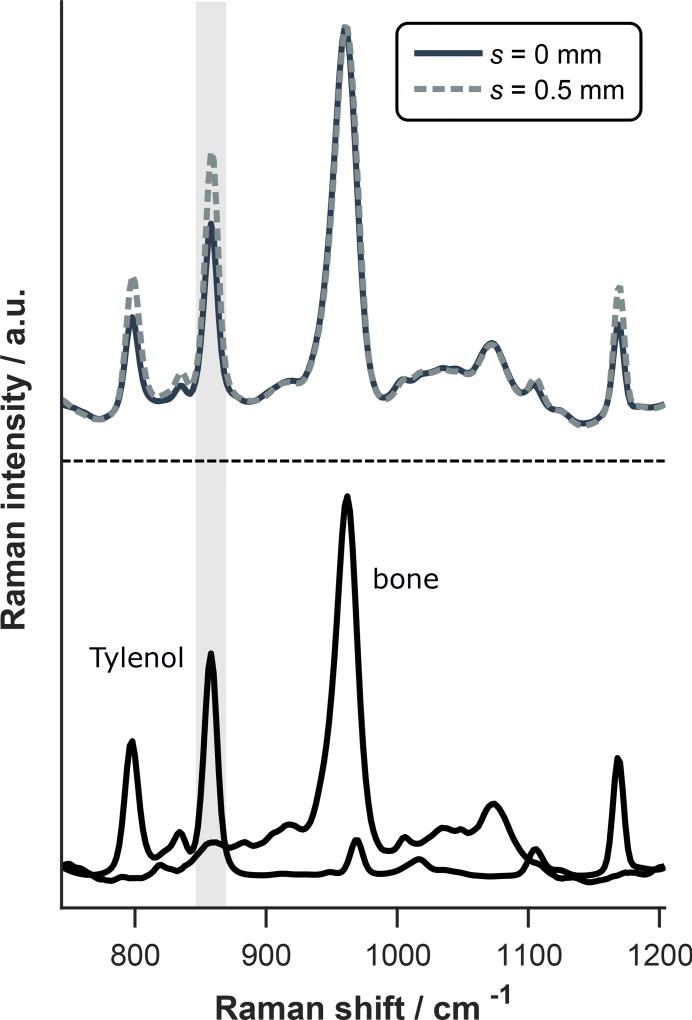
(top) Raman spectra of two-layer bone and Tylenol sample acquired at different spatial offsets and each normalized to the phosphate peak near 960 cm−1. Spectra of cortical bone and Tylenol alone are also included for comparison (bottom). Note that the relative signal from the lower (Tylenol) layer is larger at s = 0.5 mm as highlighted by the gray column indicating greater sensitivity to the subcortical space.
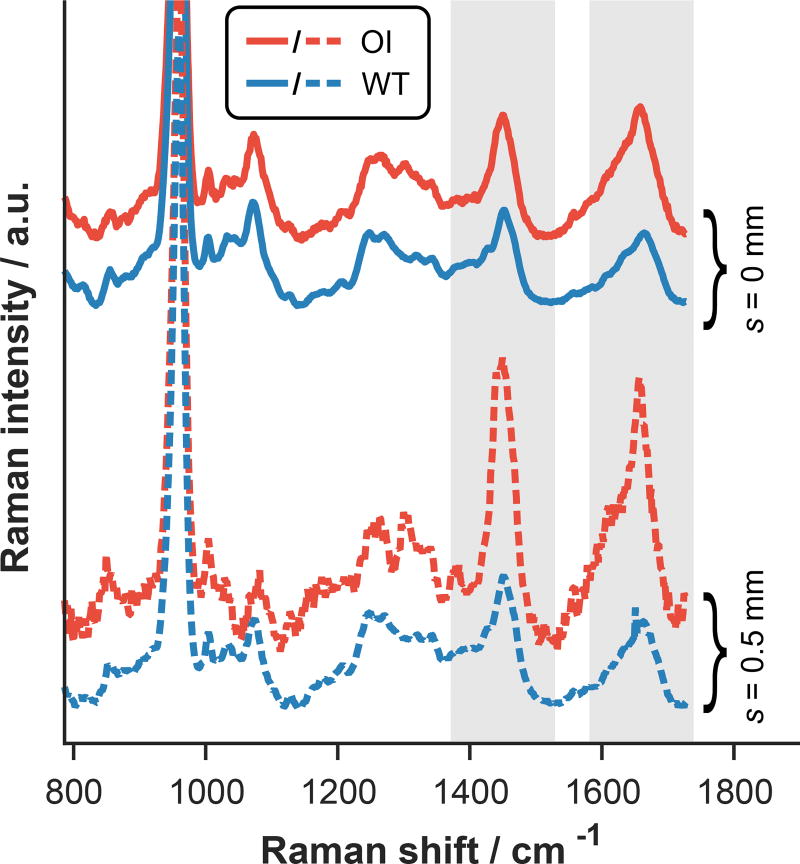
Representative SORS data acquired from the epiphyses of WT and OI tibiae at different spatial offsets and all normalized to the height of the phosphate peak near 960 cm−1. Spectroscopic differences between the WT and OI data are more apparent at deeper sampling depths (probed with s = 0.5 mm) as highlighted by the gray columns.
References
Publication types
MeSH terms
Grants and funding
LinkOut - more resources
Full Text Sources
Other Literature Sources
