Comparative Study
. 2017 Apr;141(4):2933.
doi: 10.1121/1.4979703.

Syllable-constituent perception by hearing-aid users: Common factors in quiet and noise

Affiliations
Comparative Study

Syllable-constituent perception by hearing-aid users: Common factors in quiet and noise

James D Miller et al. J Acoust Soc Am. 2017 Apr.

Abstract

The abilities of 59 adult hearing-aid users to hear phonetic details were assessed by measuring their abilities to identify syllable constituents in quiet and in differing levels of noise (12-talker babble) while wearing their aids. The set of sounds consisted of 109 frequently occurring syllable constituents (45 onsets, 28 nuclei, and 36 codas) spoken in varied phonetic contexts by eight talkers. In nominal quiet, a speech-to-noise ratio (SNR) of 40 dB, scores of individual listeners ranged from about 23% to 85% correct. Averaged over the range of SNRs commonly encountered in noisy situations, scores of individual listeners ranged from about 10% to 71% correct. The scores in quiet and in noise were very strongly correlated, R = 0.96. This high correlation implies that common factors play primary roles in the perception of phonetic details in quiet and in noise. Otherwise said, hearing-aid users' problems perceiving phonetic details in noise appear to be tied to their problems perceiving phonetic details in quiet and vice versa.


Figures
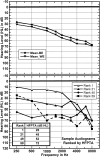
FIG. 1.
FIG. 1.
Average audiograms for the better and worse ears of the 59 participants are shown on the upper panel. Better ear audiograms are shown in the lower panel for four individual listeners ranked by their HFPTAs.
FIG. 2.
FIG. 2.
Percent correct syllable-constituent identification as a function of SNR averaged across all 59 listeners. The weighted average of the scores for nuclei, onsets, and codas is shown by the dotted line. It is each individual's weighted average that is reported in the remainder of the paper.
FIG. 3.
FIG. 3.
Data points (filled circles), fitted logistics (curves), and interpolated points over the range of commonly encountered SNRs (thick vertical lines) are shown for a sample of six listeners selected so that their scores in quiet (PCq's) are spaced at about 12% intervals. The averages of the interpolated points (PCn's) are shown as grey diamonds. The thin grey vertical lines are at an SNR of 5 dB (Smeds et al., 2015), the average SNR encountered by hearing-aid users. Each listener's percent correct at the SNR of 5 dB (PC(5)) is given by the intersection of the vertical grey line and the fitted logistic. Note that the interpolated points are near to or between the observed points. These graphs are typical of those for all of the 59 listeners, which can be viewed at the link provided in the supplementary material.
FIG. 4.
FIG. 4.
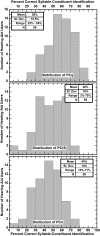
The distribution of the 59 scores for syllable-constituent identification in quiet, PCq (upper panel), at an SNR of 5 dB, PC(5) (middle panel), and the average score for SNRs of −5, 0, 5, 10, and 15 dB, PCn (bottom panel).
FIG. 5.
FIG. 5.
The relation between syllable-constituent identification in quiet and in noise. The upper-left panel shows the scatter plot of the percent correct at an SNR of 5 dB, PC(5), against the percent correct in quiet, PCq. The lower left panel shows the scatter plot of the percent correct over the range of commonly encountered SNRs that range from −5 to 15 dB (PCn) against the percent correct in quiet, PCq. The inset tables give the relevant correlational statistics. The dashed lines show limits on the percent correct as determined by chance and the assumption that the score in quiet sets an upper limit on the score in noise. The right-hand panels show the distributions of differences between observed and fitted scores.
FIG. 6.
FIG. 6.
Showing the relation between the fitted slopes (upper panel) and inflection points (lower panel) of the logistic and the identification scores in quiet. Model II regression lines are shown (Sokal and Rohlf, 1995). The upper panel shows that there is a weak tendency for the slope to decrease as PCq increases. The lower panel shows that the SNR at the fitted inflection point decreases as the PCq increases. Both relations combine to increase the score in noise as the score in quiet increases.
FIG. 7.
FIG. 7.
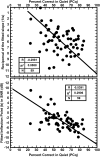
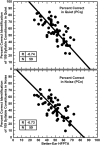
Scatter plots of syllable-constituent identification in quiet, PCq, (upper panel) and syllable-constituent identification in noise, PCn, (lower panel) against the high frequency pure tone average, HFPTA, are shown for the 59 hearing-aid users. The model II regression lines (Sokal and Rohlf, 1995) are shown. The corresponding correlations are shown in the inset tables on each panel. The y-intercept on the lower panel suggests that the loss of the ability to identify syllable constituents in noise begins with HFPTAs as low as 5 dB HL. It is also apparent that considerable variance remains after allowing for the HFPTA.
FIG. 8.
FIG. 8.
Showing the multiple correlation between PCn measured by interpolation and PCn′ found by the best linear combination of the fitted parameters ua, b, and LN(1/s) as shown in Eq. (A1). Clearly, the patterns of the three measured points in the PC by SNR space allow accurate estimation of syllable-constituent identification in noise as 98.26% of the variance in PCn is accounted for and the standard error of the estimate is only 1.87%.
FIG. 9.
FIG. 9.
Showing the correlation between PCn′ calculated by Eq. (A2) and the PCn found by interpolation along each listener's fitted logistic. It can be seen that this relation is slightly less constrained than that shown in Fig. 8. While the multiple R accounts for 98.3% of the variance in PCn, when only ua is used the R accounts for 91.5% of the variance in PCn. This difference is mirrored in the standard errors of the estimates.
FIG. 10.
FIG. 10.
Showing the relation between PCn′ calculated from Eq. (A3) and PCn. The inflection point accounts for 61.25% of the variance in PCn. However, as will be shown, it only adds about 6.24% to the variance in PCn that is accounted for by the correlation with the upper asymptote, ua. Although it cannot be seen in this plot, as the inflection point increases in SNR, PCn declines.
FIG. 11.
FIG. 11.
Showing the relation between PCn′ calculated by Eq. (A4) and PCn. The slope has little influence on PCn except for a few cases. As will be shown, the slope accounts for only 12.75% of the variance in PCn, but only adds a 0.51% reduction in the variance in PCn accounted for by the upper asymptote and the inflection point. Although not shown, the steeper the slope the lower PCn.

Similar articles

Cited by

References

    1. Allen, J. B. (1996). “ Harvey Fletcher's role in the creation of communication acoustics,” J. Acoust. Soc. Am. 99, 1825–1839.10.1121/1.415364 - DOI - PubMed
    1. Boothroyd, A. , and Nittrouer, S. (1988). “ Mathematical treatment of context effects in speech recognition,” J. Acoust. Soc. Am. 84, 101–114.10.1121/1.396976 - DOI - PubMed
    1. Bronkhorst, A. , Bosman, A. , and Smoorenberg, G. (1993). “ A model for context effects in speech recognition,” J. Acoust. Soc. Am. 93, 499–509.10.1121/1.406844 - DOI - PubMed
    1. Bronkhorst, A. , Brand, T. , and Wagener, K. (2002). “ Evaluation of context effects in sentence recognition,” J. Acoust. Soc. Am. 111, 2874–2886.10.1121/1.1458025 - DOI - PubMed
    1. French, N. R. , and Steinberg, J. C. (1947). “ Factors governing the intelligibility of speech sounds,” J. Acoust. Soc. Am. 19, 90–119.10.1121/1.1916407 - DOI

Publication types

MeSH terms