

Effect of catalpol on remyelination through experimental autoimmune encephalomyelitis acting to promote Olig1 and Olig2 expressions in mice
- PMID: 28464811
- PMCID: PMC5414219
- DOI: 10.1186/s12906-017-1642-2
Effect of catalpol on remyelination through experimental autoimmune encephalomyelitis acting to promote Olig1 and Olig2 expressions in mice
Retraction in
-
Retraction Note: Effect of catalpol on remyelination through experimental autoimmune encephalomyelitis acting to promote Olig1 and Olig2 expressions in mice.BMC Complement Med Ther. 2023 Oct 7;23(1):355. doi: 10.1186/s12906-023-04196-1. BMC Complement Med Ther. 2023. PMID: 37805567 Free PMC article. No abstract available.
Abstract
Background: Multiple sclerosis (MS) as an autoimmune disorder is a common disease occurring in central nervous system (CNS) and the remyelination plays a pivotal role in the alleviating neurological impairment in the MS. Catalpol, an effective component extracted from the Chinese herb Radix Rehmanniae, which has been proved protective in cerebral diseases.
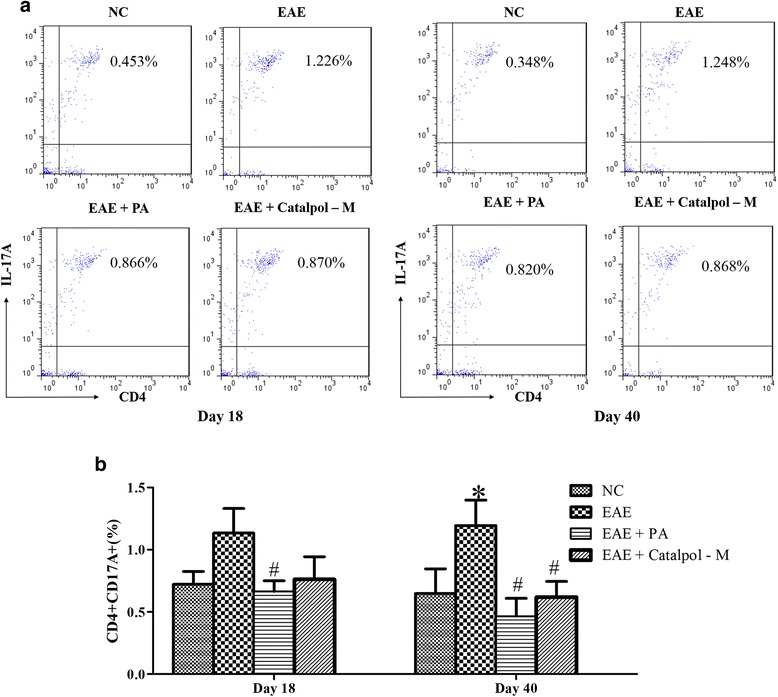
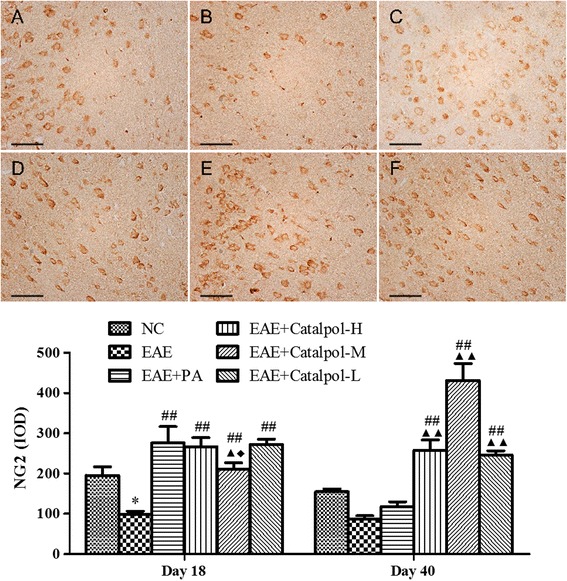
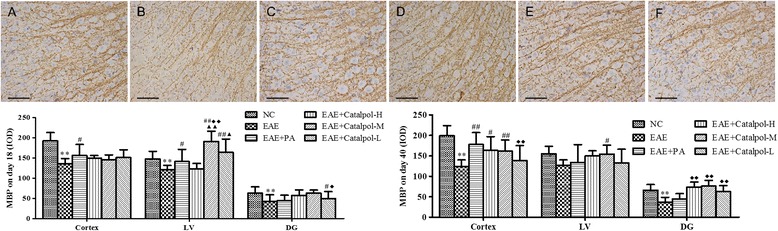
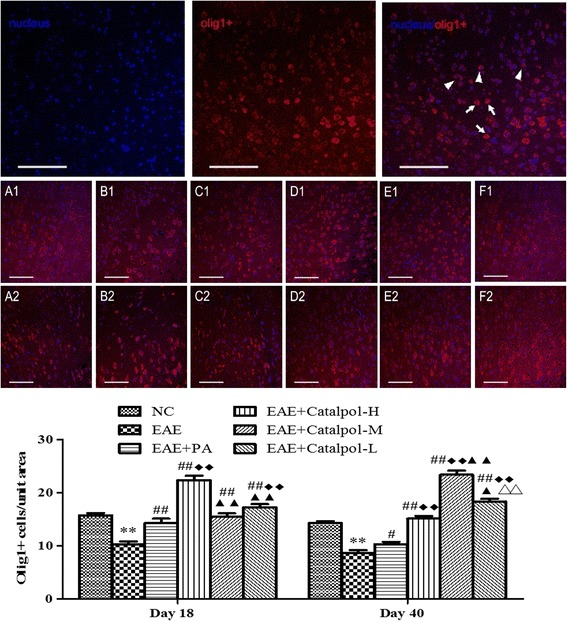
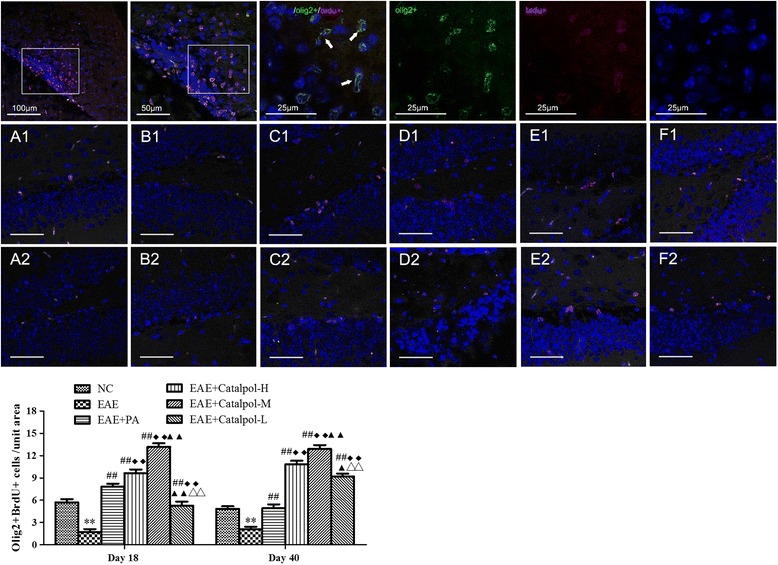
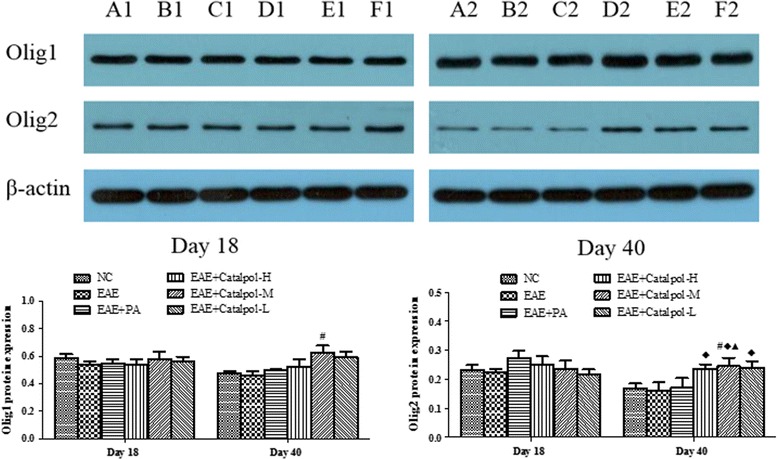
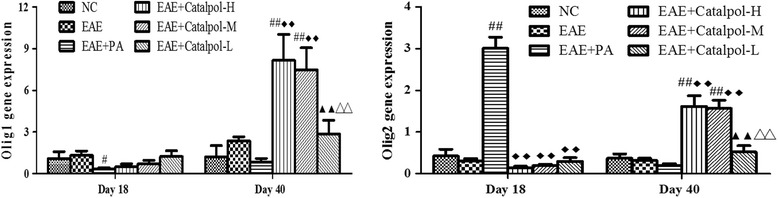
Methods: To determine the protective effects and mechanisms of Catalpol on MS, the mice with experimental autoimmune encephalomyelitis (EAE) were induced by myelin oligodendrocyte glycoprotein (MOG) 35-55, as a model for human MS. Th17 cells were counted by flow cytometric (FCM). The expressions of nerve-glial antigen (NG) 2 and myelin basic protein (MBP) were measured by immunohistochemical staining. Olig1+ and Olig2+/BrdU+ cells were counted by immunofluorescence. Olig1 and Olig2 gene expressions were detected by real-time fluorescent quantitative reverse transcription (qRT) -PCR.
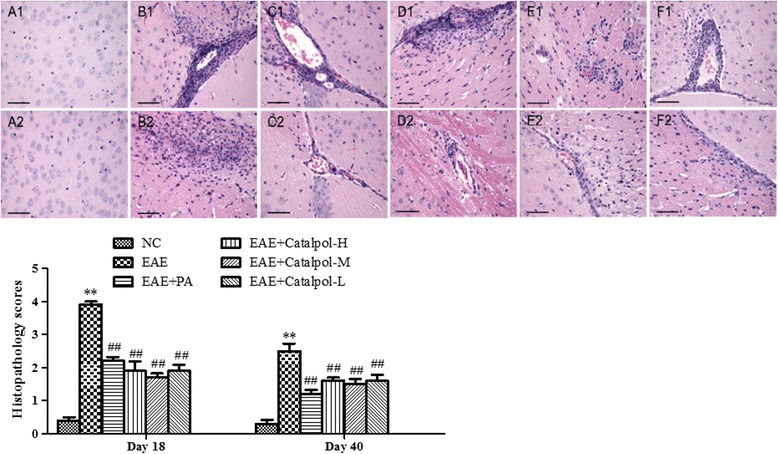
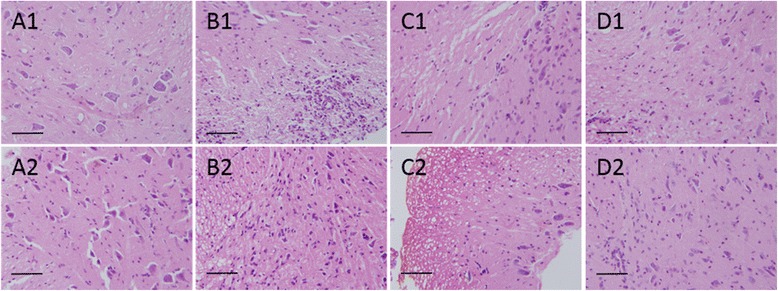
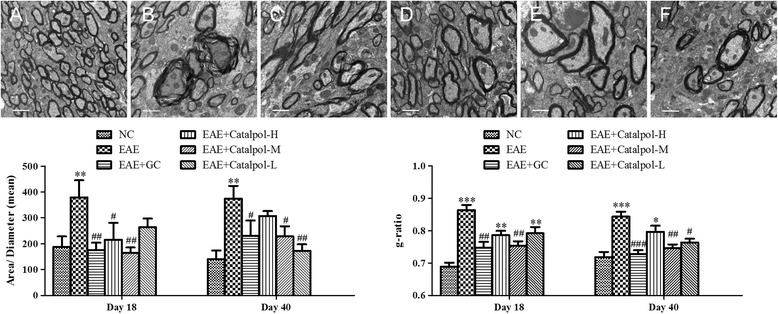
Results: The results showed that Catalpol improved neurological function, reduced inflammatory cell infiltration and demyelination. It could decrease Th17 cells in the peripheral blood. It increased the protein expressions of NG2 and MBP in mice brains, up-regulated markedly protein and gene expressions of Olig1 and Olig2 in terms of timing, site and targets.
Conclusions: These data demonstrated that Catalpol had a strong neuroprotective effect on EAE mice. Catalpol also plays a role in remyelination by promoting the expressions of Olig1 and Olig2 transcription factors.
Keywords: Catalpol; Experimental autoimmune encephalomyelitis; Multiple sclerosis; Olig1; Olig2; Remyelination.
Figures

Similar articles
-
Effect of Bushen Yisui Capsule () on oligodendrocyte lineage genes 1 and 2 in mice with experimental autoimmune encephalomyelitis.Chin J Integr Med. 2016 Dec;22(12):932-940. doi: 10.1007/s11655-015-2431-8. Epub 2016 Feb 26. Chin J Integr Med. 2016. PMID: 26919831
-
Delayed onset of experimental autoimmune encephalomyelitis in Olig1 deficient mice.PLoS One. 2010 Sep 29;5(9):e13083. doi: 10.1371/journal.pone.0013083. PLoS One. 2010. PMID: 20927333 Free PMC article.
-
[Effect of Yishen Daluo Decoction on the expression of PLP, Olig1, and Olig2 in mice with experimental autoimmune encephalomyelitis].Zhongguo Zhong Xi Yi Jie He Za Zhi. 2014 May;34(5):562-5. Zhongguo Zhong Xi Yi Jie He Za Zhi. 2014. PMID: 24941845 Chinese.
-
Separated at birth? The functional and molecular divergence of OLIG1 and OLIG2.Nat Rev Neurosci. 2012 Dec;13(12):819-31. doi: 10.1038/nrn3386. Nat Rev Neurosci. 2012. PMID: 23165259 Free PMC article. Review.
-
Nudging oligodendrocyte intrinsic signaling to remyelinate and repair: Estrogen receptor ligand effects.J Steroid Biochem Mol Biol. 2016 Jun;160:43-52. doi: 10.1016/j.jsbmb.2016.01.006. Epub 2016 Jan 14. J Steroid Biochem Mol Biol. 2016. PMID: 26776441 Free PMC article. Review.
Cited by
-
Ibogaine administration following repeated morphine administration upregulates myelination markers 2', 3'-cyclic nucleotide 3'-phosphodiesterase (CNP) and myelin basic protein (MBP) mRNA and protein expression in the internal capsule of Sprague Dawley rats.Front Neurosci. 2024 Jul 24;18:1378841. doi: 10.3389/fnins.2024.1378841. eCollection 2024. Front Neurosci. 2024. PMID: 39114487 Free PMC article.
-
Radix Rehmanniae Extract Ameliorates Experimental Autoimmune Encephalomyelitis by Suppressing Macrophage-Derived Nitrative Damage.Front Physiol. 2018 Jul 20;9:864. doi: 10.3389/fphys.2018.00864. eCollection 2018. Front Physiol. 2018. PMID: 30079025 Free PMC article.
-
Effect and Mechanism of Catalpol on Remyelination via Regulation of the NOTCH1 Signaling Pathway.Front Pharmacol. 2021 Feb 23;12:628209. doi: 10.3389/fphar.2021.628209. eCollection 2021. Front Pharmacol. 2021. PMID: 33708131 Free PMC article.
-
Metformin-induced AMPK activation stimulates remyelination through induction of neurotrophic factors, downregulation of NogoA and recruitment of Olig2+ precursor cells in the cuprizone murine model of multiple sclerosis.Daru. 2019 Dec;27(2):583-592. doi: 10.1007/s40199-019-00286-z. Epub 2019 Oct 16. Daru. 2019. PMID: 31620963 Free PMC article.
-
Sex Effect on Cardiac Damage in Mice With Experimental Autoimmune Encephalomyelitis.ASN Neuro. 2021 Jan-Dec;13:1759091421991771. doi: 10.1177/1759091421991771. ASN Neuro. 2021. PMID: 33541127 Free PMC article.
References
Publication types
MeSH terms
Substances
LinkOut - more resources
Full Text Sources
Other Literature Sources
Medical
Miscellaneous
