

Highly divergent patterns of genetic diversity and evolution in proviral quasispecies from HIV controllers
- PMID: 28464889
- PMCID: PMC5414336
- DOI: 10.1186/s12977-017-0354-5
Highly divergent patterns of genetic diversity and evolution in proviral quasispecies from HIV controllers
Abstract
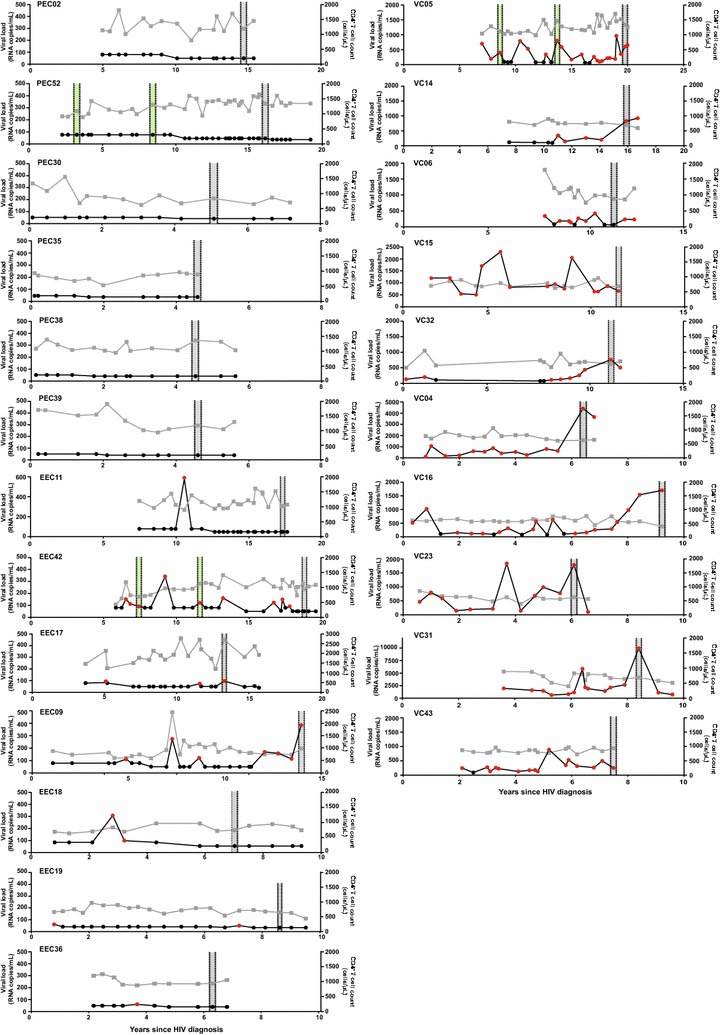
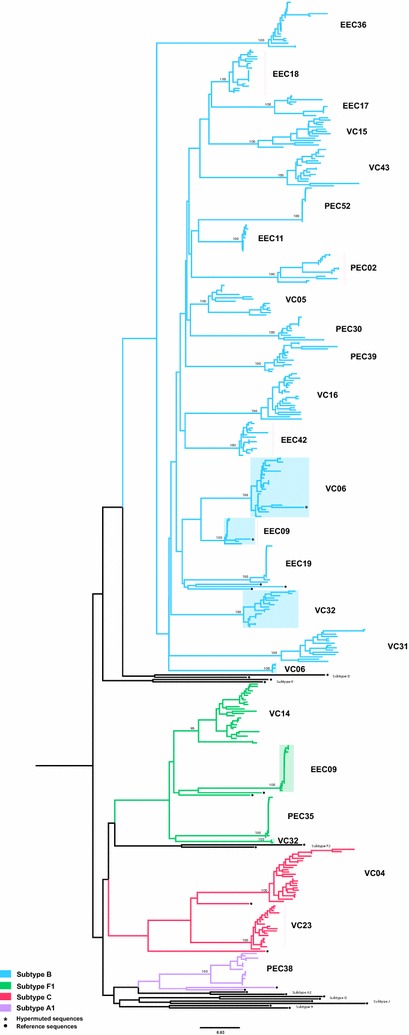
Background: Ongoing intra-host HIV-1 evolution has been shown in individuals that naturally suppress the viremia to low levels (HIV controllers) by the analysis of the RNA in plasma compartment. Detection of evolution at the DNA proviral compartment in HIV controllers, however, has been more challenging and the precise correlation between the systemic viral suppression level and rate of reservoir's reseeding in those individuals is not fully understood. In this sense, we examined the proviral DNA quasispecies by single genome amplification of the env gene in a cohort of 23 HIV controllers from Brazil, divided in three groups, according to the level of systemic viral suppression: (1) elite controllers with persistent undetectable viral load (PEC, n = 6); (2) elite controllers with occasional episodes of transient (51-400 copies/mL) viremia (EEC, n = 7); and (3) viremic controllers with persistent low-level (80-2000 copies/mL) viremia (VC, n = 10).
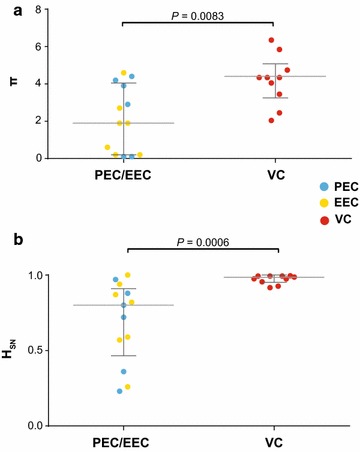
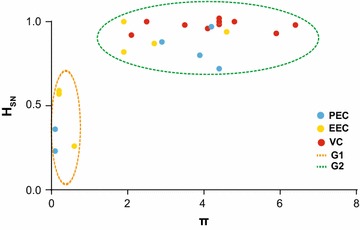
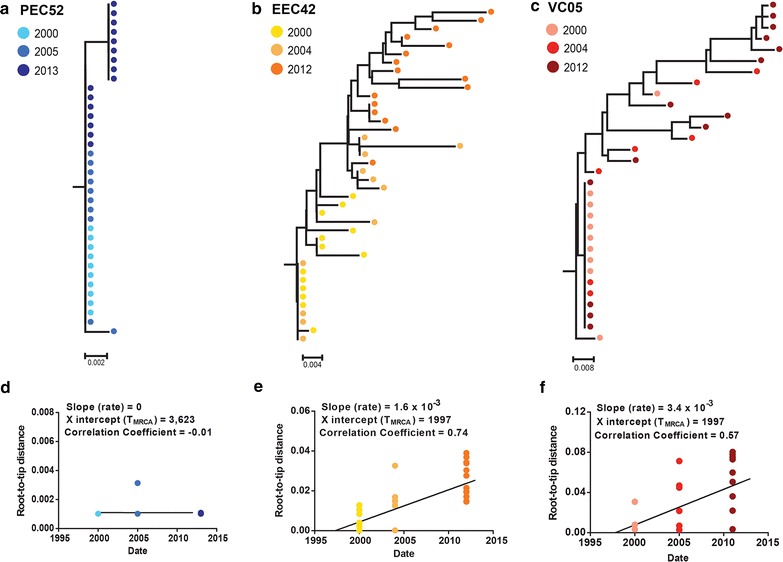
Results: The HIV-1 diversity of the PBMC-associated proviral quasispecies in EC was significantly (P < 0.01) lower than in VC, but not significantly different between PEC and EEC groups. We detected a considerable variation in the average pairwise nucleotide distance and proportion of unique sequences in the HIV-1 proviral quasispecies of PEC and EEC. Some PEC and EEC displayed highly homogenous proviral populations with large clusters of identical sequences, while others exhibited relatively diverse proviral populations with a high proportion of unique sequences comparable to VC subjects. The long-term (10-15 years) follow-up of the HIV-1 proviral populations revealed a complete evolutionary stasis in one PEC and measurable divergence rates in one EEC [3.1 (1.2-5.6) × 10-3 substitutions/site/year and one VC [2.9 (0.7-5.1) × 10-3 substitutions/site/year].
Conclusions: There is no simple relationship between systemic viral suppression and intra-host proviral diversity or rate of reservoir's reseeding in chronically infected HIV controllers. Our results demonstrate that very divergent patterns of intra-host viral diversity and divergence could be detected in the setting of natural suppression of HIV-1 replication and that ongoing evolution and reseeding of the PBMC proviral reservoir occurs in some elite controllers.
Keywords: Diversity; Elite controllers; Evolution; HIV-1; Reseeding; Reservoir; Viremic controllers.
Figures
Similar articles
-
HIV Proviral Burden, Genetic Diversity, and Dynamics in Viremic Controllers Who Subsequently Initiated Suppressive Antiretroviral Therapy.mBio. 2021 Dec 21;12(6):e0249021. doi: 10.1128/mBio.02490-21. Epub 2021 Nov 16. mBio. 2021. PMID: 34781741 Free PMC article.
-
Ongoing HIV-1 evolution and reservoir reseeding in two elite controllers with genetically diverse peripheral proviral quasispecies.Mem Inst Oswaldo Cruz. 2023 Jun 5;118:e230066. doi: 10.1590/0074-02760230066. eCollection 2023. Mem Inst Oswaldo Cruz. 2023. PMID: 37283423 Free PMC article.
-
Genetic diversity in the env V1-V2 region of proviral quasispecies from long-term controller MHC-typed cynomolgus macaques infected with SHIVSF162P4cy.J Gen Virol. 2018 Dec;99(12):1717-1728. doi: 10.1099/jgv.0.001159. Epub 2018 Oct 12. J Gen Virol. 2018. PMID: 30311877
-
Single-molecule techniques to quantify and genetically characterise persistent HIV.Retrovirology. 2018 Jan 9;15(1):3. doi: 10.1186/s12977-017-0386-x. Retrovirology. 2018. PMID: 29316955 Free PMC article. Review.
-
New Approaches to Multi-Parametric HIV-1 Genetics Using Multiple Displacement Amplification: Determining the What, How, and Where of the HIV-1 Reservoir.Viruses. 2021 Dec 10;13(12):2475. doi: 10.3390/v13122475. Viruses. 2021. PMID: 34960744 Free PMC article. Review.
Cited by
-
Gut Microbiome Profiles and Associated Metabolic Pathways in HIV-Infected Treatment-Naïve Patients.Cells. 2021 Feb 13;10(2):385. doi: 10.3390/cells10020385. Cells. 2021. PMID: 33668457 Free PMC article.
-
Encapsidation of Staufen-2 Enhances Infectivity of HIV-1.Viruses. 2021 Dec 8;13(12):2459. doi: 10.3390/v13122459. Viruses. 2021. PMID: 34960728 Free PMC article.
-
Intracellular Diversity of WNV within Circulating Avian Peripheral Blood Mononuclear Cells Reveals Host-Dependent Patterns of Polyinfection.Pathogens. 2023 May 26;12(6):767. doi: 10.3390/pathogens12060767. Pathogens. 2023. PMID: 37375457 Free PMC article.
-
CD8+ T cells in HIV control, cure and prevention.Nat Rev Immunol. 2020 Aug;20(8):471-482. doi: 10.1038/s41577-020-0274-9. Epub 2020 Feb 12. Nat Rev Immunol. 2020. PMID: 32051540 Free PMC article. Review.
-
Genetic complexity in the replication-competent latent HIV reservoir increases with untreated infection duration in infected youth.AIDS. 2019 Feb 1;33(2):211-218. doi: 10.1097/QAD.0000000000002045. AIDS. 2019. PMID: 30325763 Free PMC article.
References
Publication types
MeSH terms
Substances
Grants and funding
LinkOut - more resources
Full Text Sources
Other Literature Sources
Medical
